writeups
Stratoshark - CSCG CTF 2025
- Challenge Name: Stratoshark
- Challenge category: forensics
- Challenge Difficulty: easy
- Challenge points: 138
- Challenge Author: dontrash
- CTF Year and Date: 2025-03-01 - 2025-05-01
- Author: nebuc42
- Date: 2025-05-12
Challenge Description
We have noticed some strange behaviour on our development server. Maybe this new tool from those Wireshark guys can help. Can you find out what is going on with our server?
Flagformat: dach2025{....}
Information Gathering
I first opened the file with wireshark and was somewhat confused: I ecpected to see a some network packets but the lines contained much less onformation. I could not imagine, that the sparse information presented could lead to any flag.
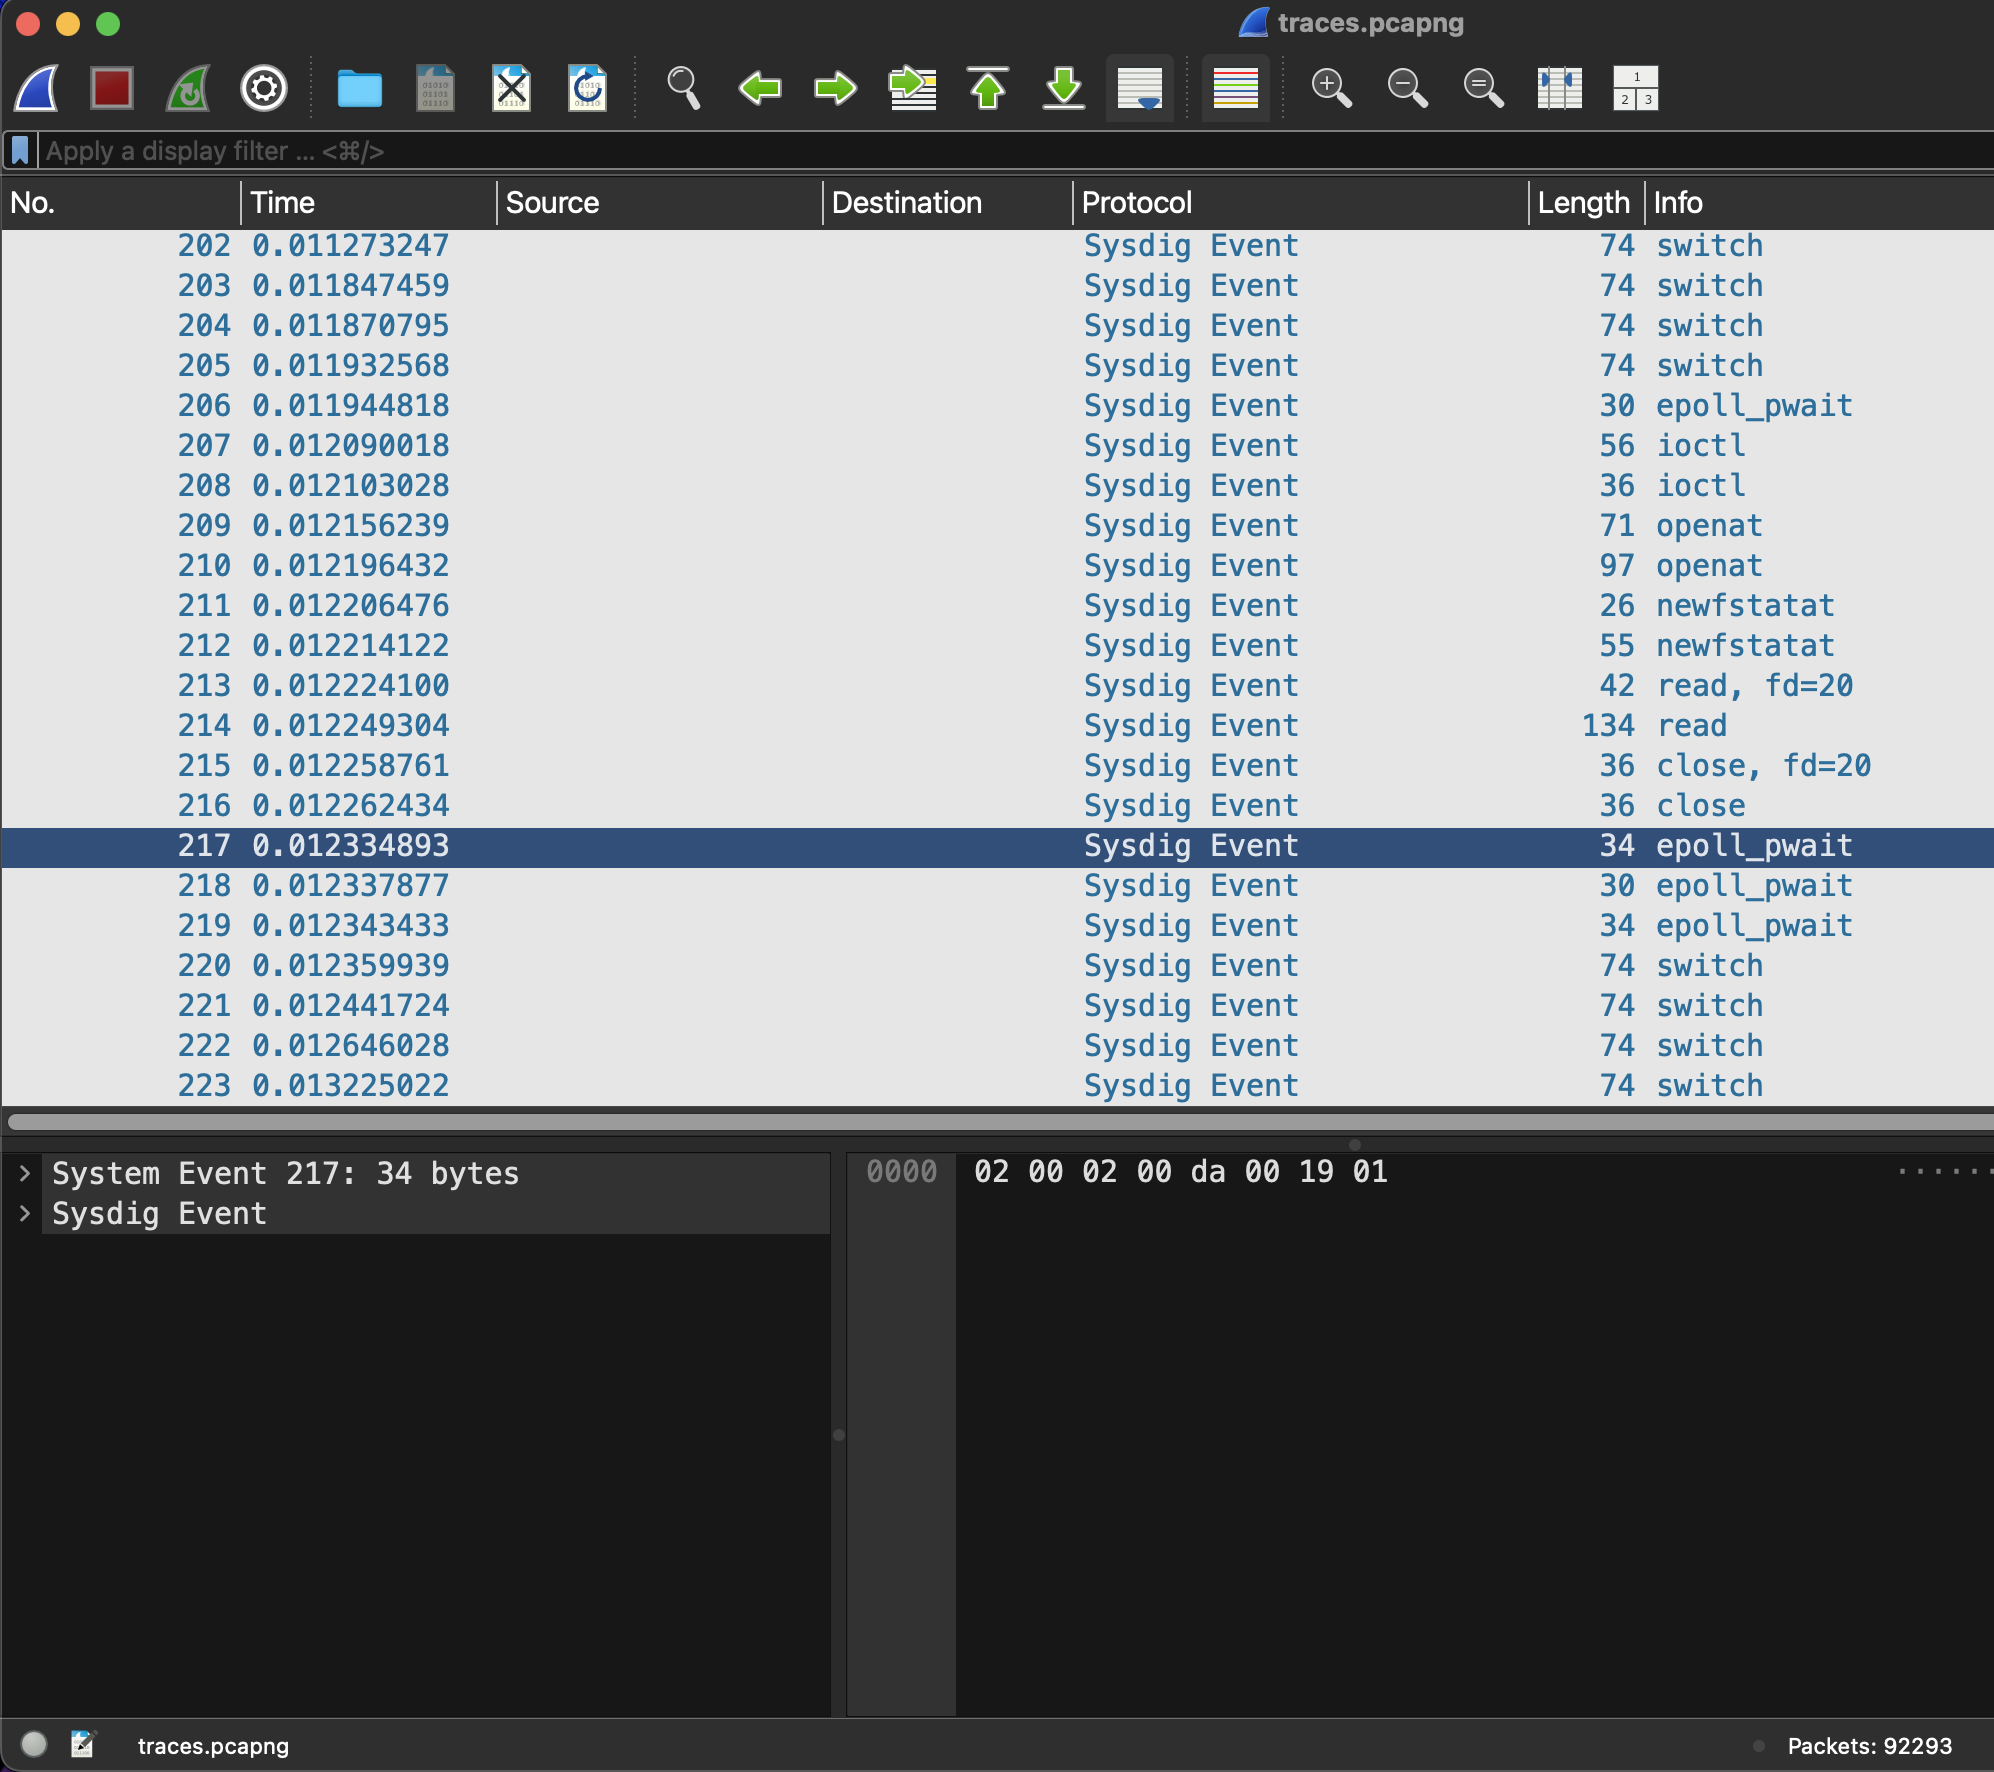
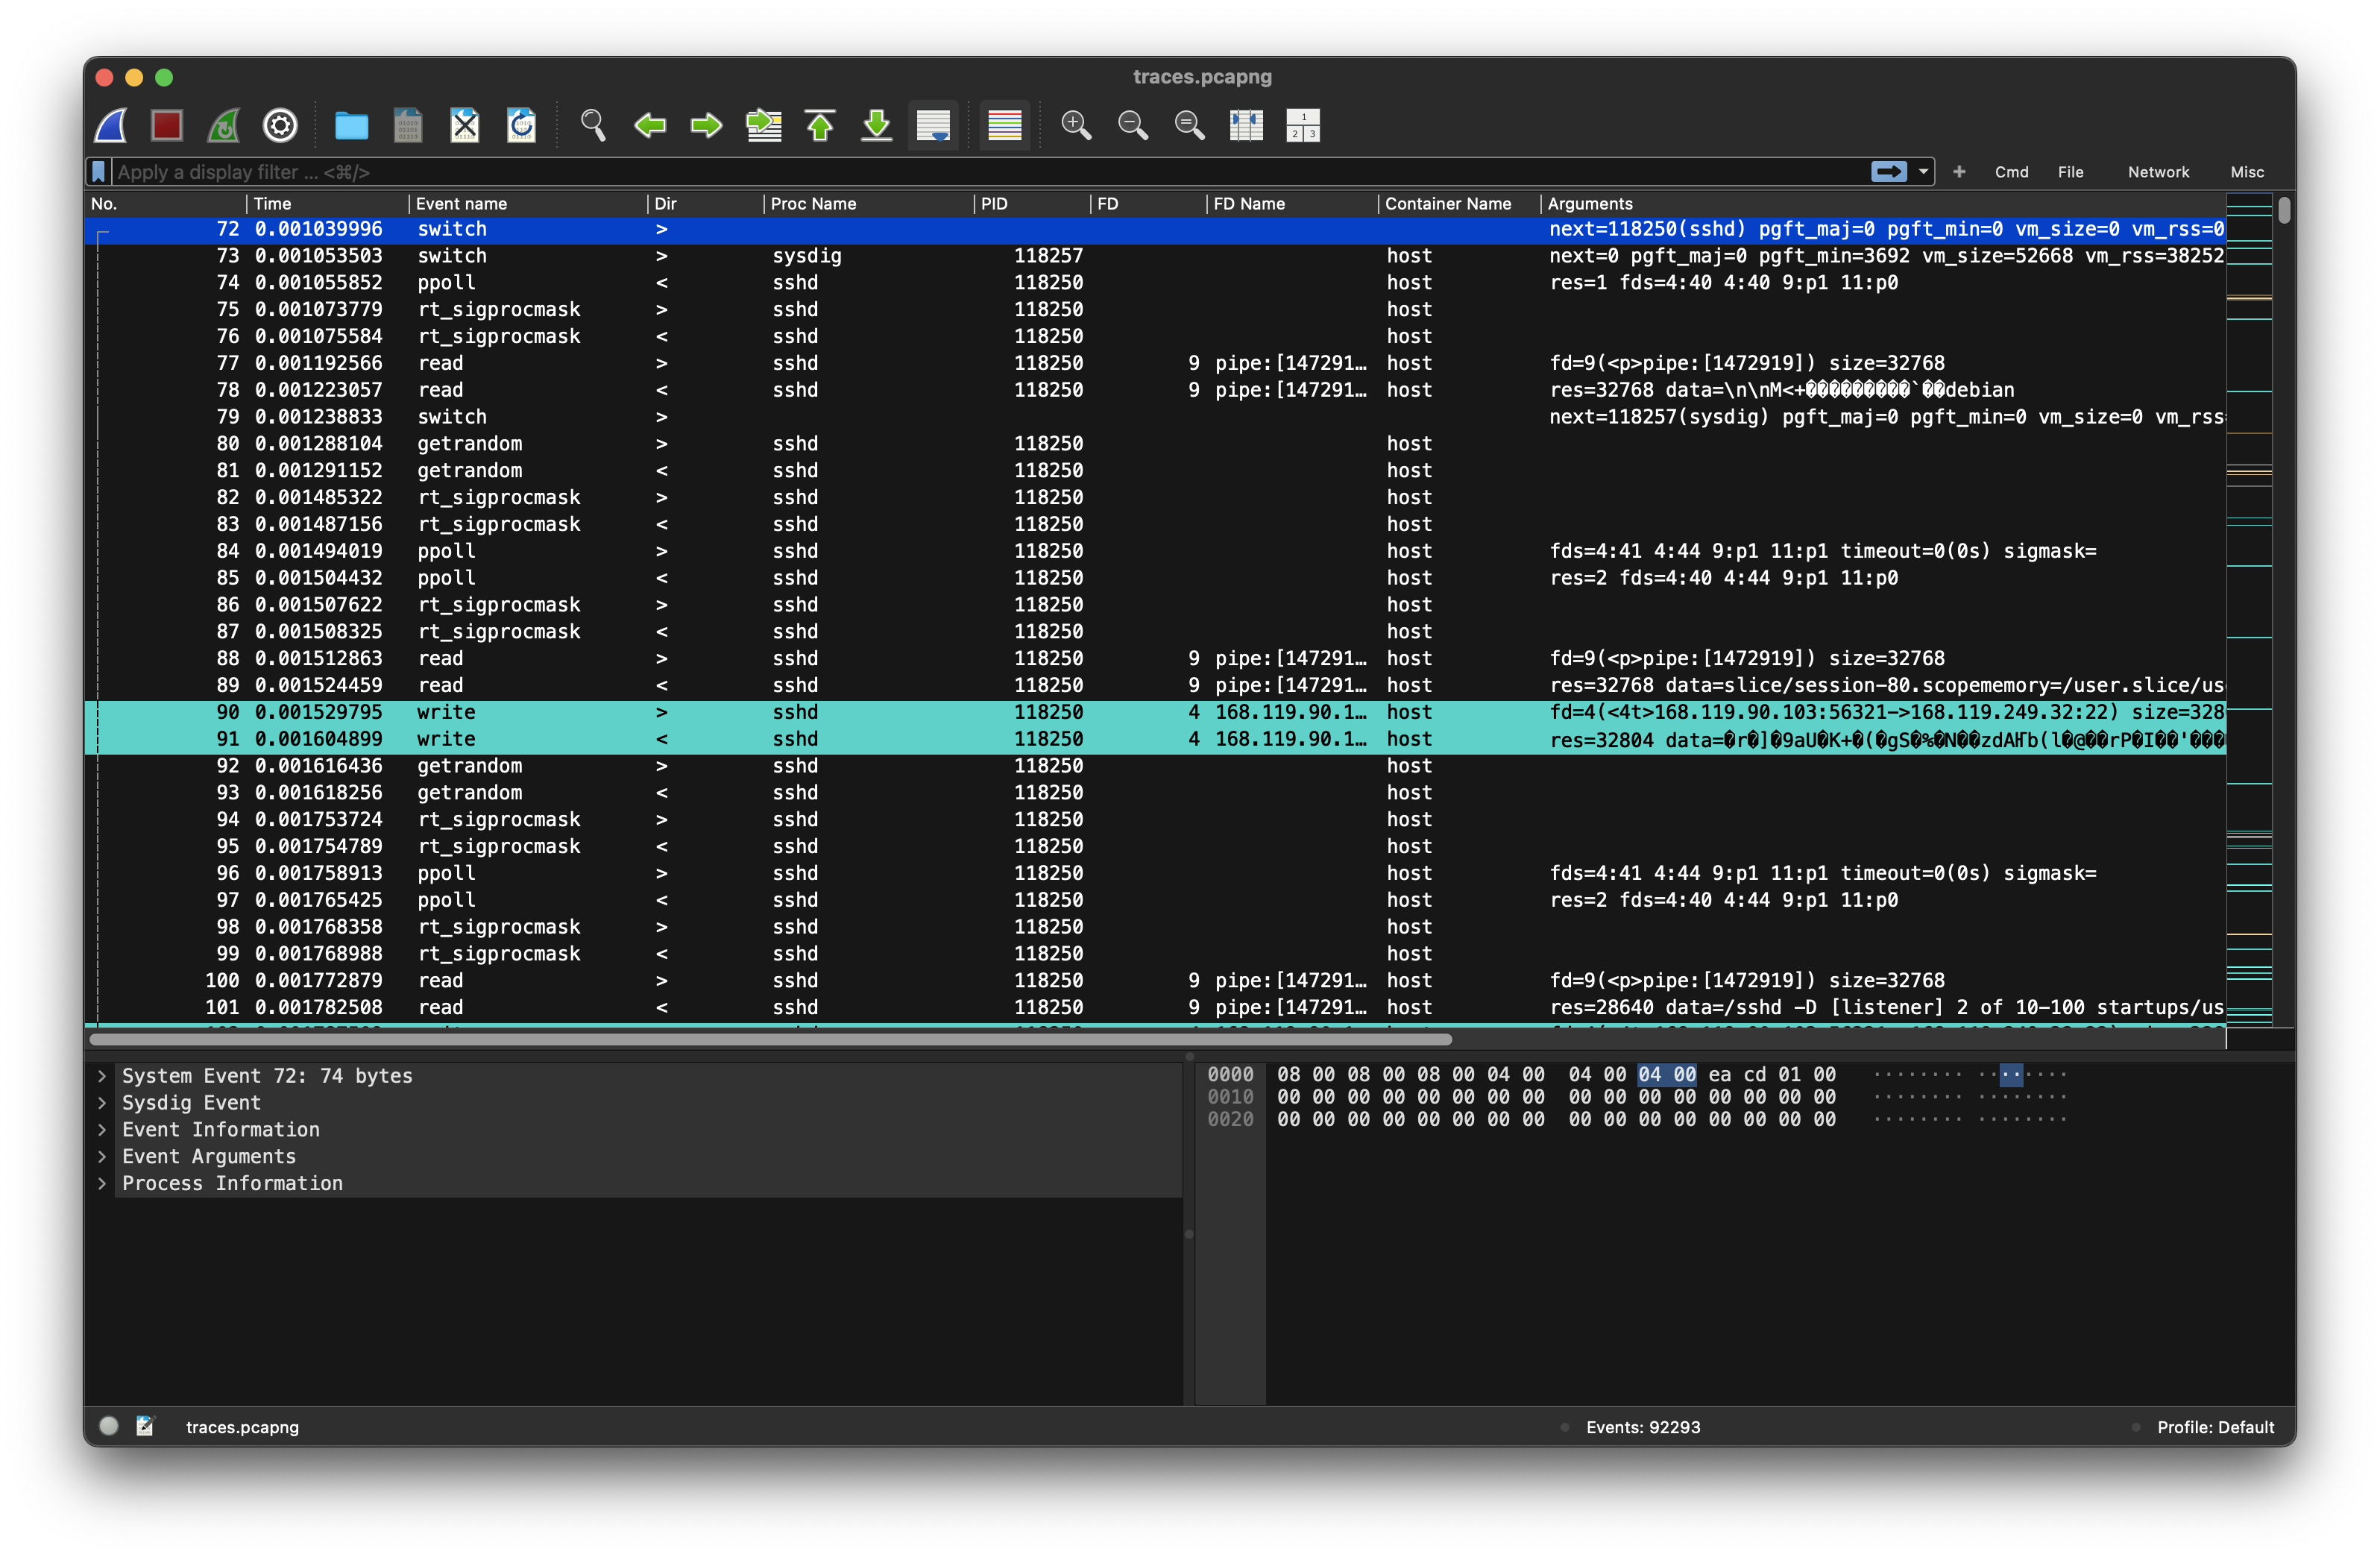
I ended up googling for “SysDig” 1 and eventually found the “stratoshark”-tool 2. After installing and opening the provided pcapng file with stratoshark there was much more information available. However, I was quickly overwhelmed with the amount of information available and had no idea of where to start after looking at the entries for a few minutes.
Rabbit-Hole (1)
I hoped, some more googling will help and ended up analyzing the pcapng file using the sysdig-tool
Getting an Overview
While the sysdig excursion did not yield any quick results, I turned back to stratoshark. Filtering did not yet make sense to me, because, I did not know, what to look for. Because stratoshark is a wireshark sibling, it also offers some statistic analysis of the file. The statistics of the current pcap yielded some interesting information.
Capture Filter Properties
Created by Stratoshark 0.9.1 (ssv0.9.1-0-g0874f1b7c52a)

File

Name: traces.pcapng
Length: 7375 kB
[redacted]

First event: 2025-01-28 14:30:07
Last event: 2025-01-28 14:30:21
Elapsed: 00:00:14

Capture
Hardware: Unknown
OS: Unknown
Application: Unknown

Interfaces

Interface: Falco plugin: cloudtrail
Dropped events: unknown
Capture filter: none
Link type: USER 0
Event size limit (snaplen): 262144 bytes

Statistics

Measurement
Events: 92293
Time span, s: 14.004
Average pps: 6590.3
Average event size, B: 64
Bytes: 5938641
Average bytes/s: 424 k
Container, process and FD/IO
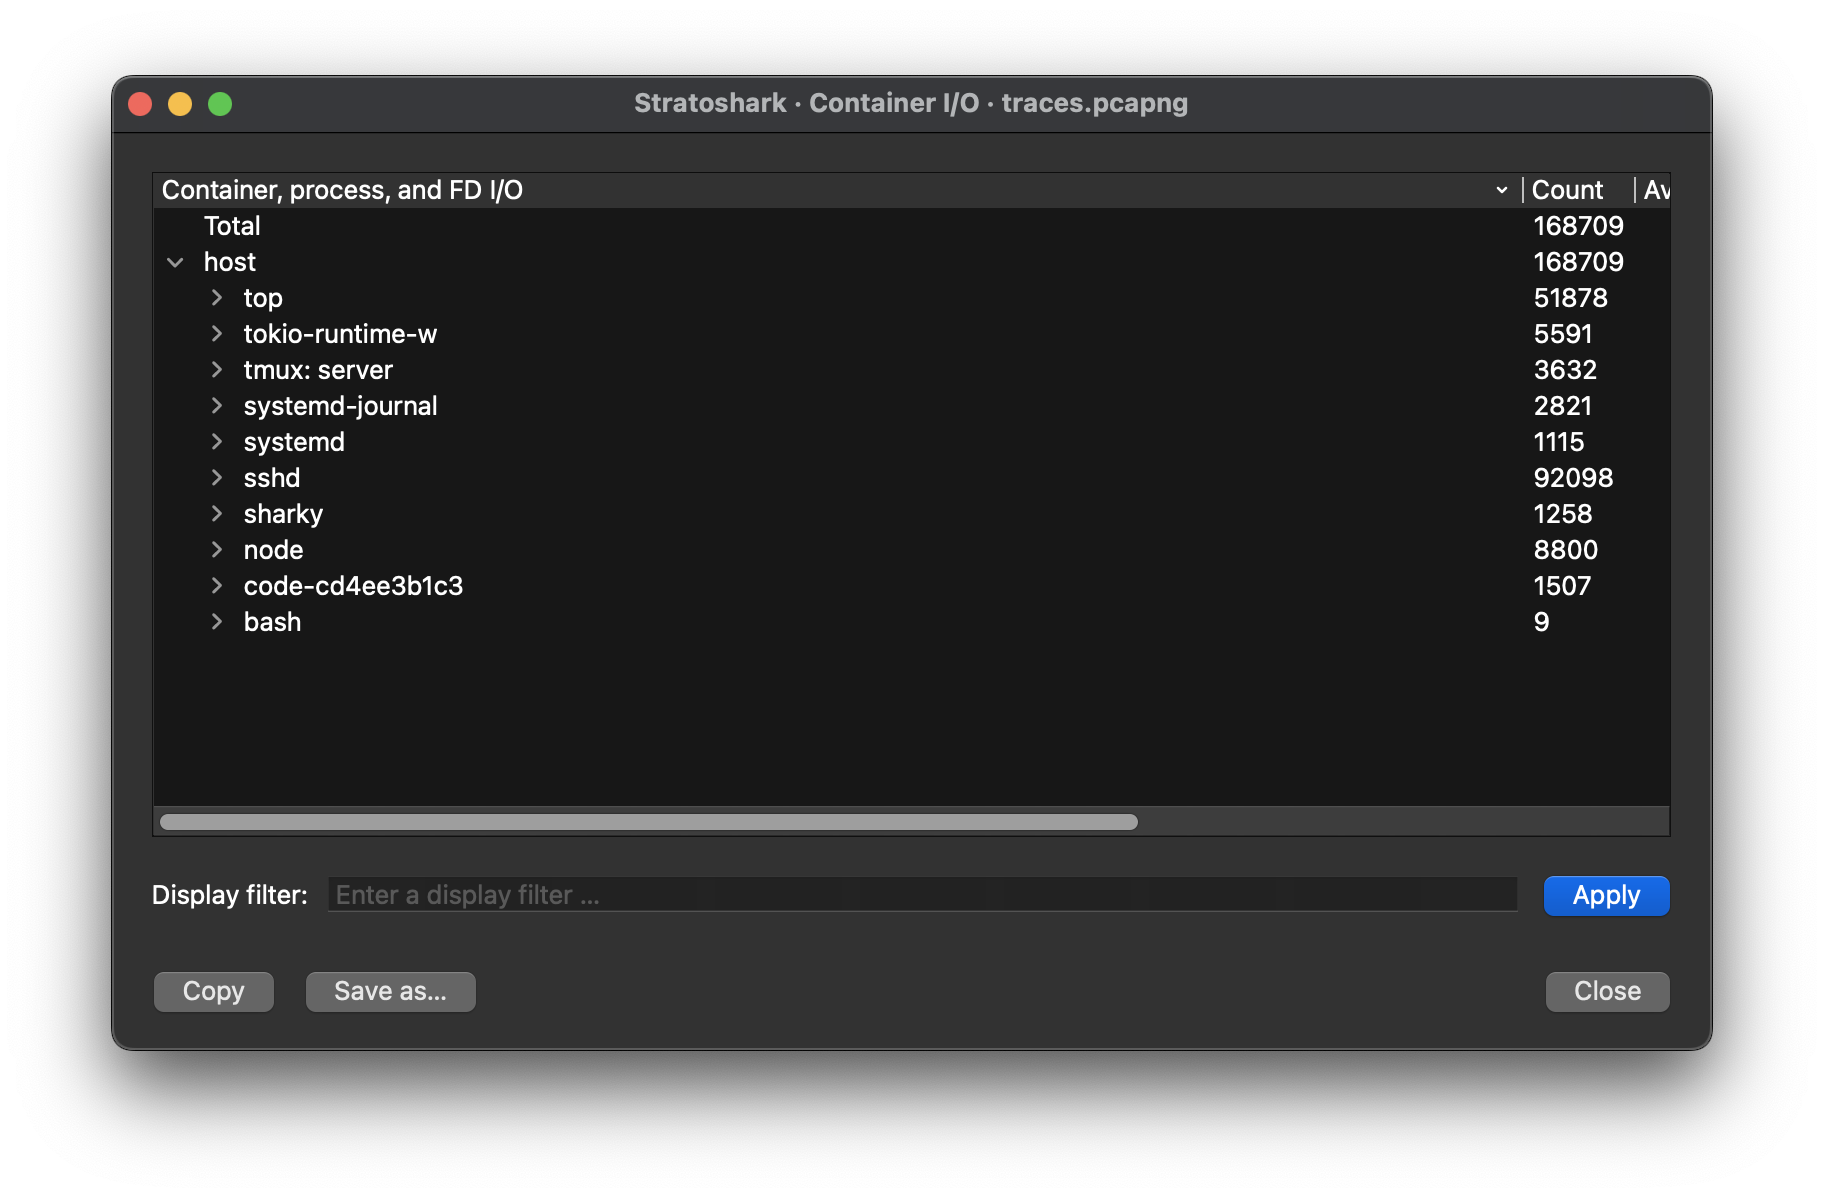
Looking at the container I/O statistics, I concluded, that the monitored system is a linux system because systemd, systemd-journal and bash are present.
I decided to have a quick look at some processes applying the display filters in stratoshark
- Node
proc.name == nodeThe node process seems to run the vs code development process. This makes sense, as the challenge description yields that this is in fact the ‘development server’ - Ssh
proc.name== ssh: There were sessions from different src addresses (). Because there is no data nor user information available in the pcap, I quickly abandoned this path. Possibly the users are connecting to the server using ssh and are tunneling the communication with the development server through ssh. - top
proc.name == top. A this time of the analysis, it the presence of the top process made no sense to me. I assumed, that one of the users logged in one of the ssh-sessions was monitoring the server, because they suspected some unusual behaviour
Sharky process
The sharky process attracted my interest. A google search gave the impression that this is not a well known process. The statistics yielded some strange behaviour: Multiple connections/writes to the the IP-address 13.3.3.7 on port 8080, write to the tmp-folder /tmp/3c6e0b8a9c15224a8228b9a98ca1531d and reading /etc/hostname and /lib/x86_64-linux-gnu/libgcc_so.so.1
The connected IP-address is owned by xerox.. (looking at the adress a second time: 13.3.3.7 makes me believe, that Xerox has nothing to do with this actions..)
This made no sense to me yet, let’s look at the events by filtering for this process proc.name == sharky
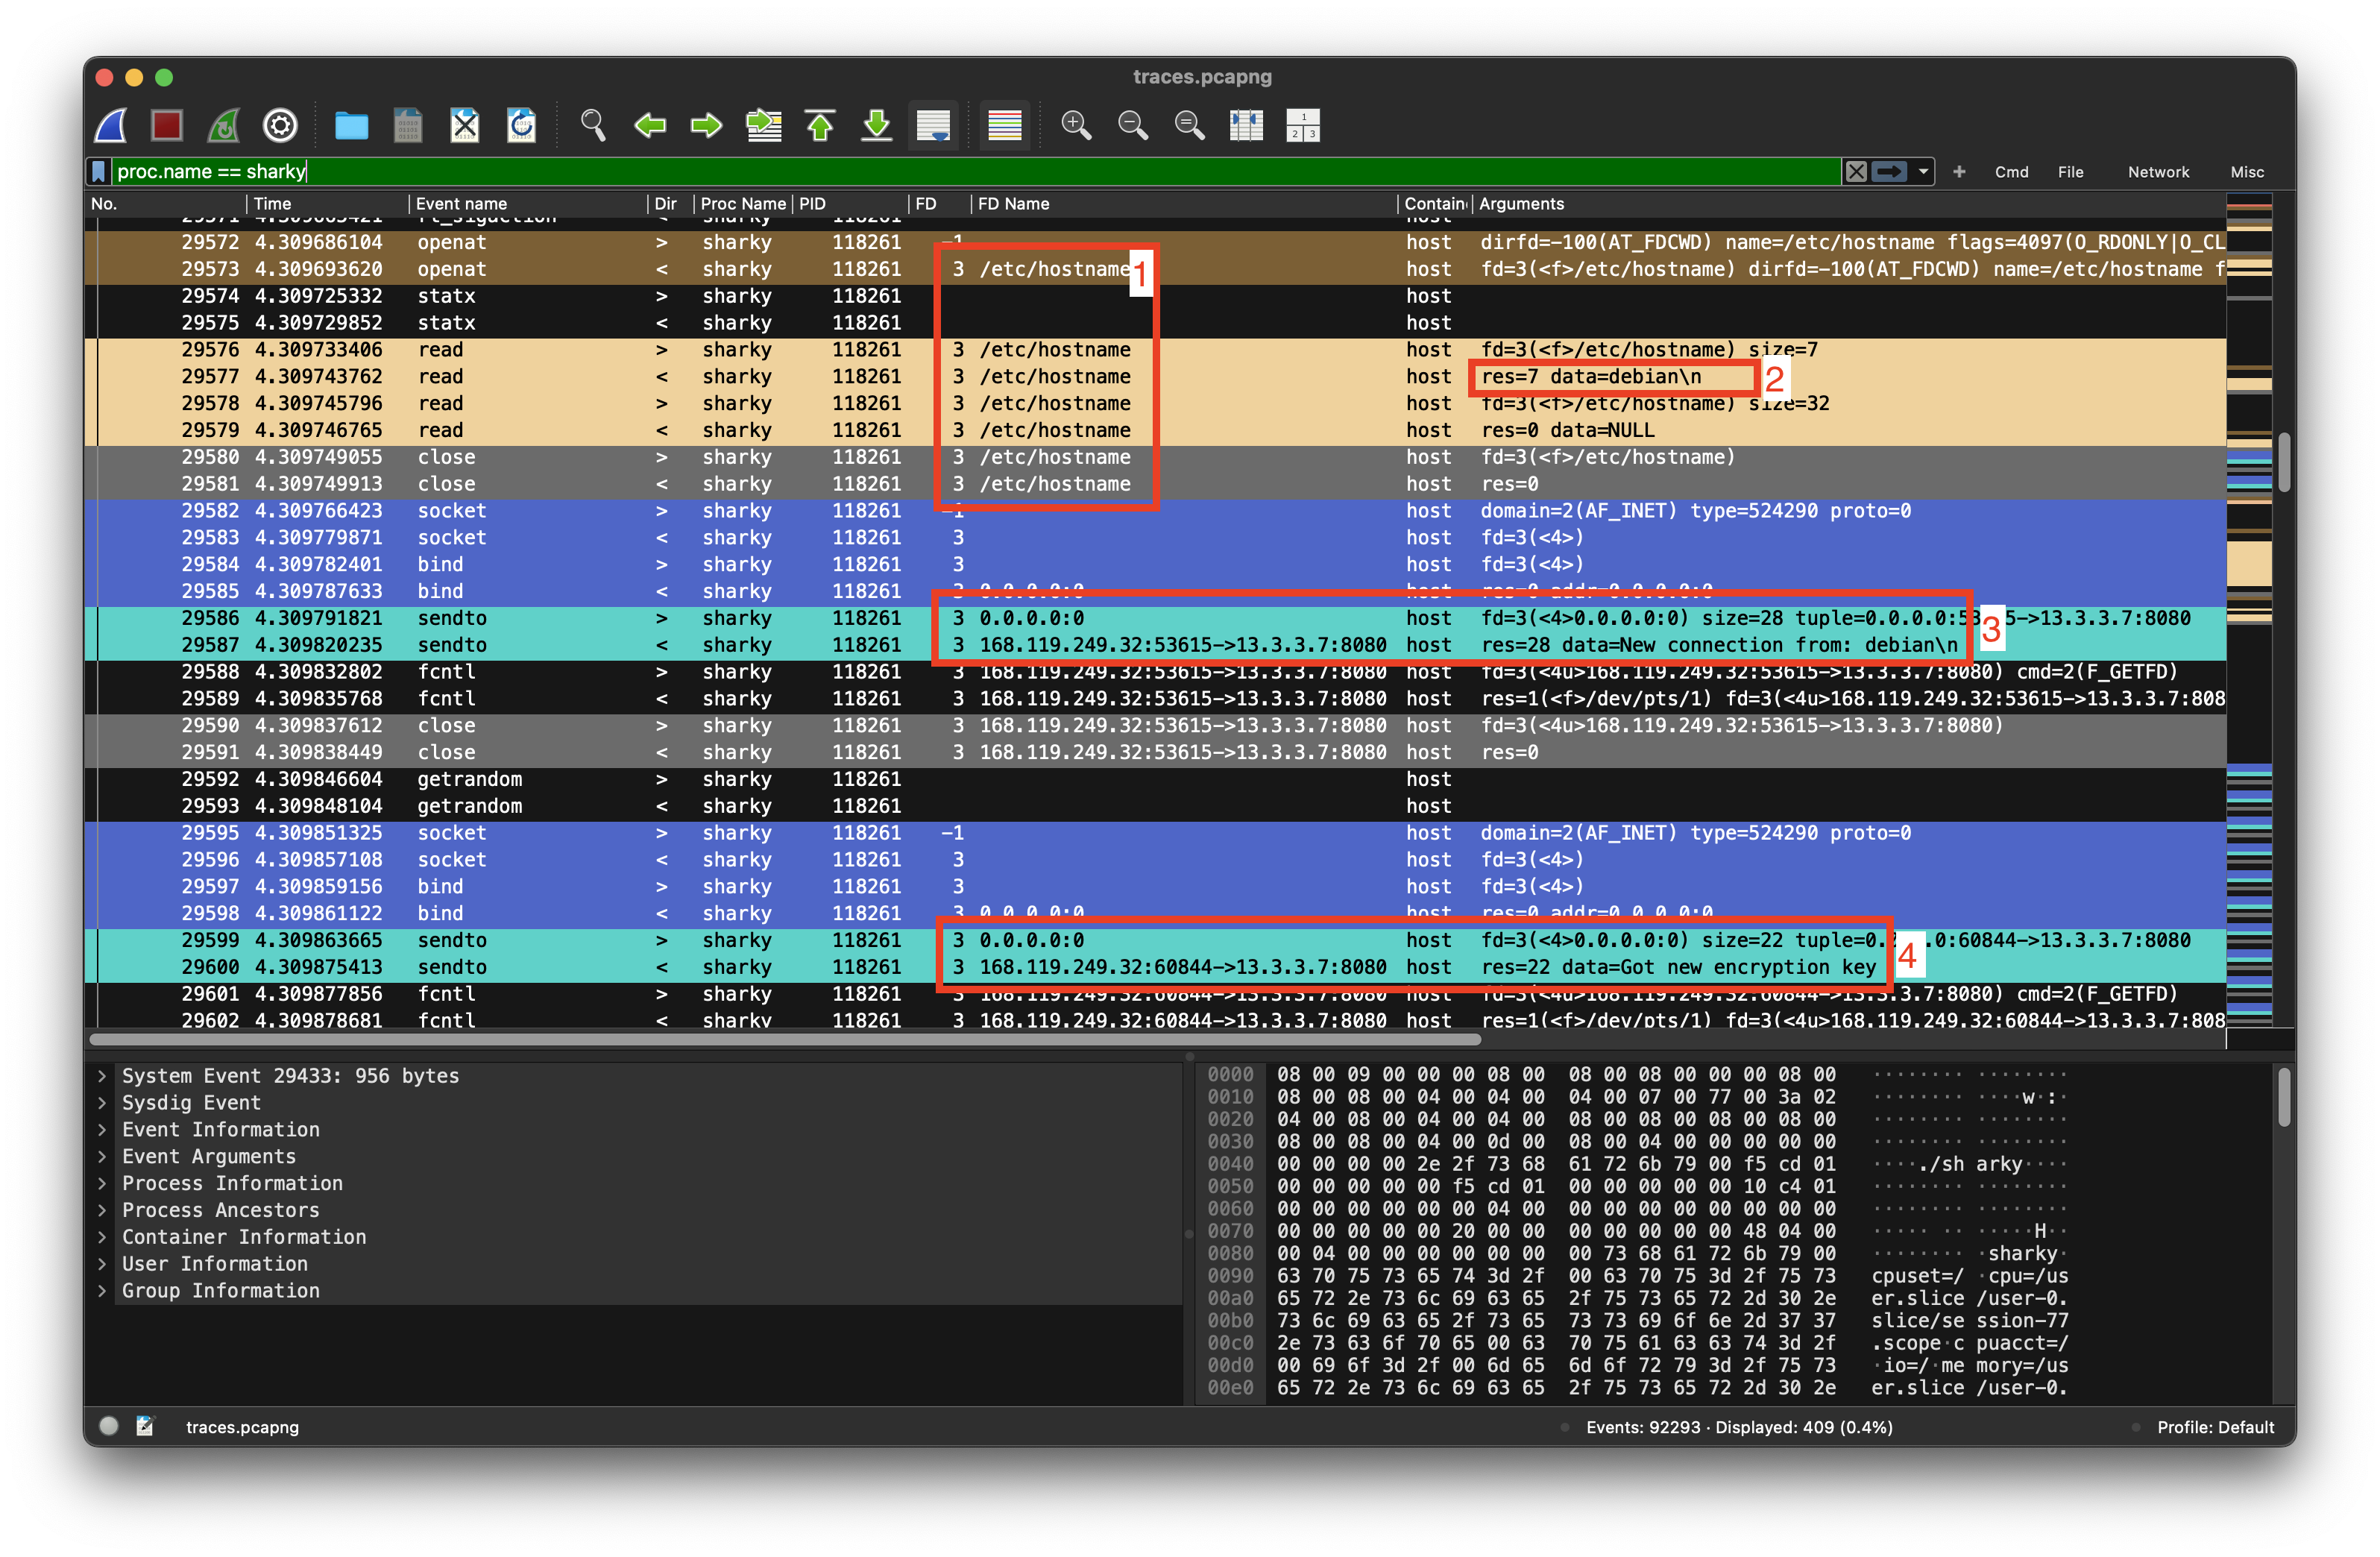
We can see some interesing actions here, that probably are connected:
- The sharky process reads
/etc/hostname(Entry #29576) - The hostname is
debian(#29577) - Sharky then connects to 13.3.3.7 and greets
from debian(#29587) - Sharky gets a
got new encryption keyfrom 13.3.37 (#29600)
At log entry #29623 the following data is written to the file /tmp/3c6e0b8a9c15224a8228b9a98ca1531d (40 Bytes)
29 94 af 5f 84 65 7f a5 5e 3f 06 81 be 09 64 13
f6 db 2d d7 dd fa 74 2a c6 02 41 3c 37 01 1c 4a
7d a4 44 66 f2 c4 f9 10

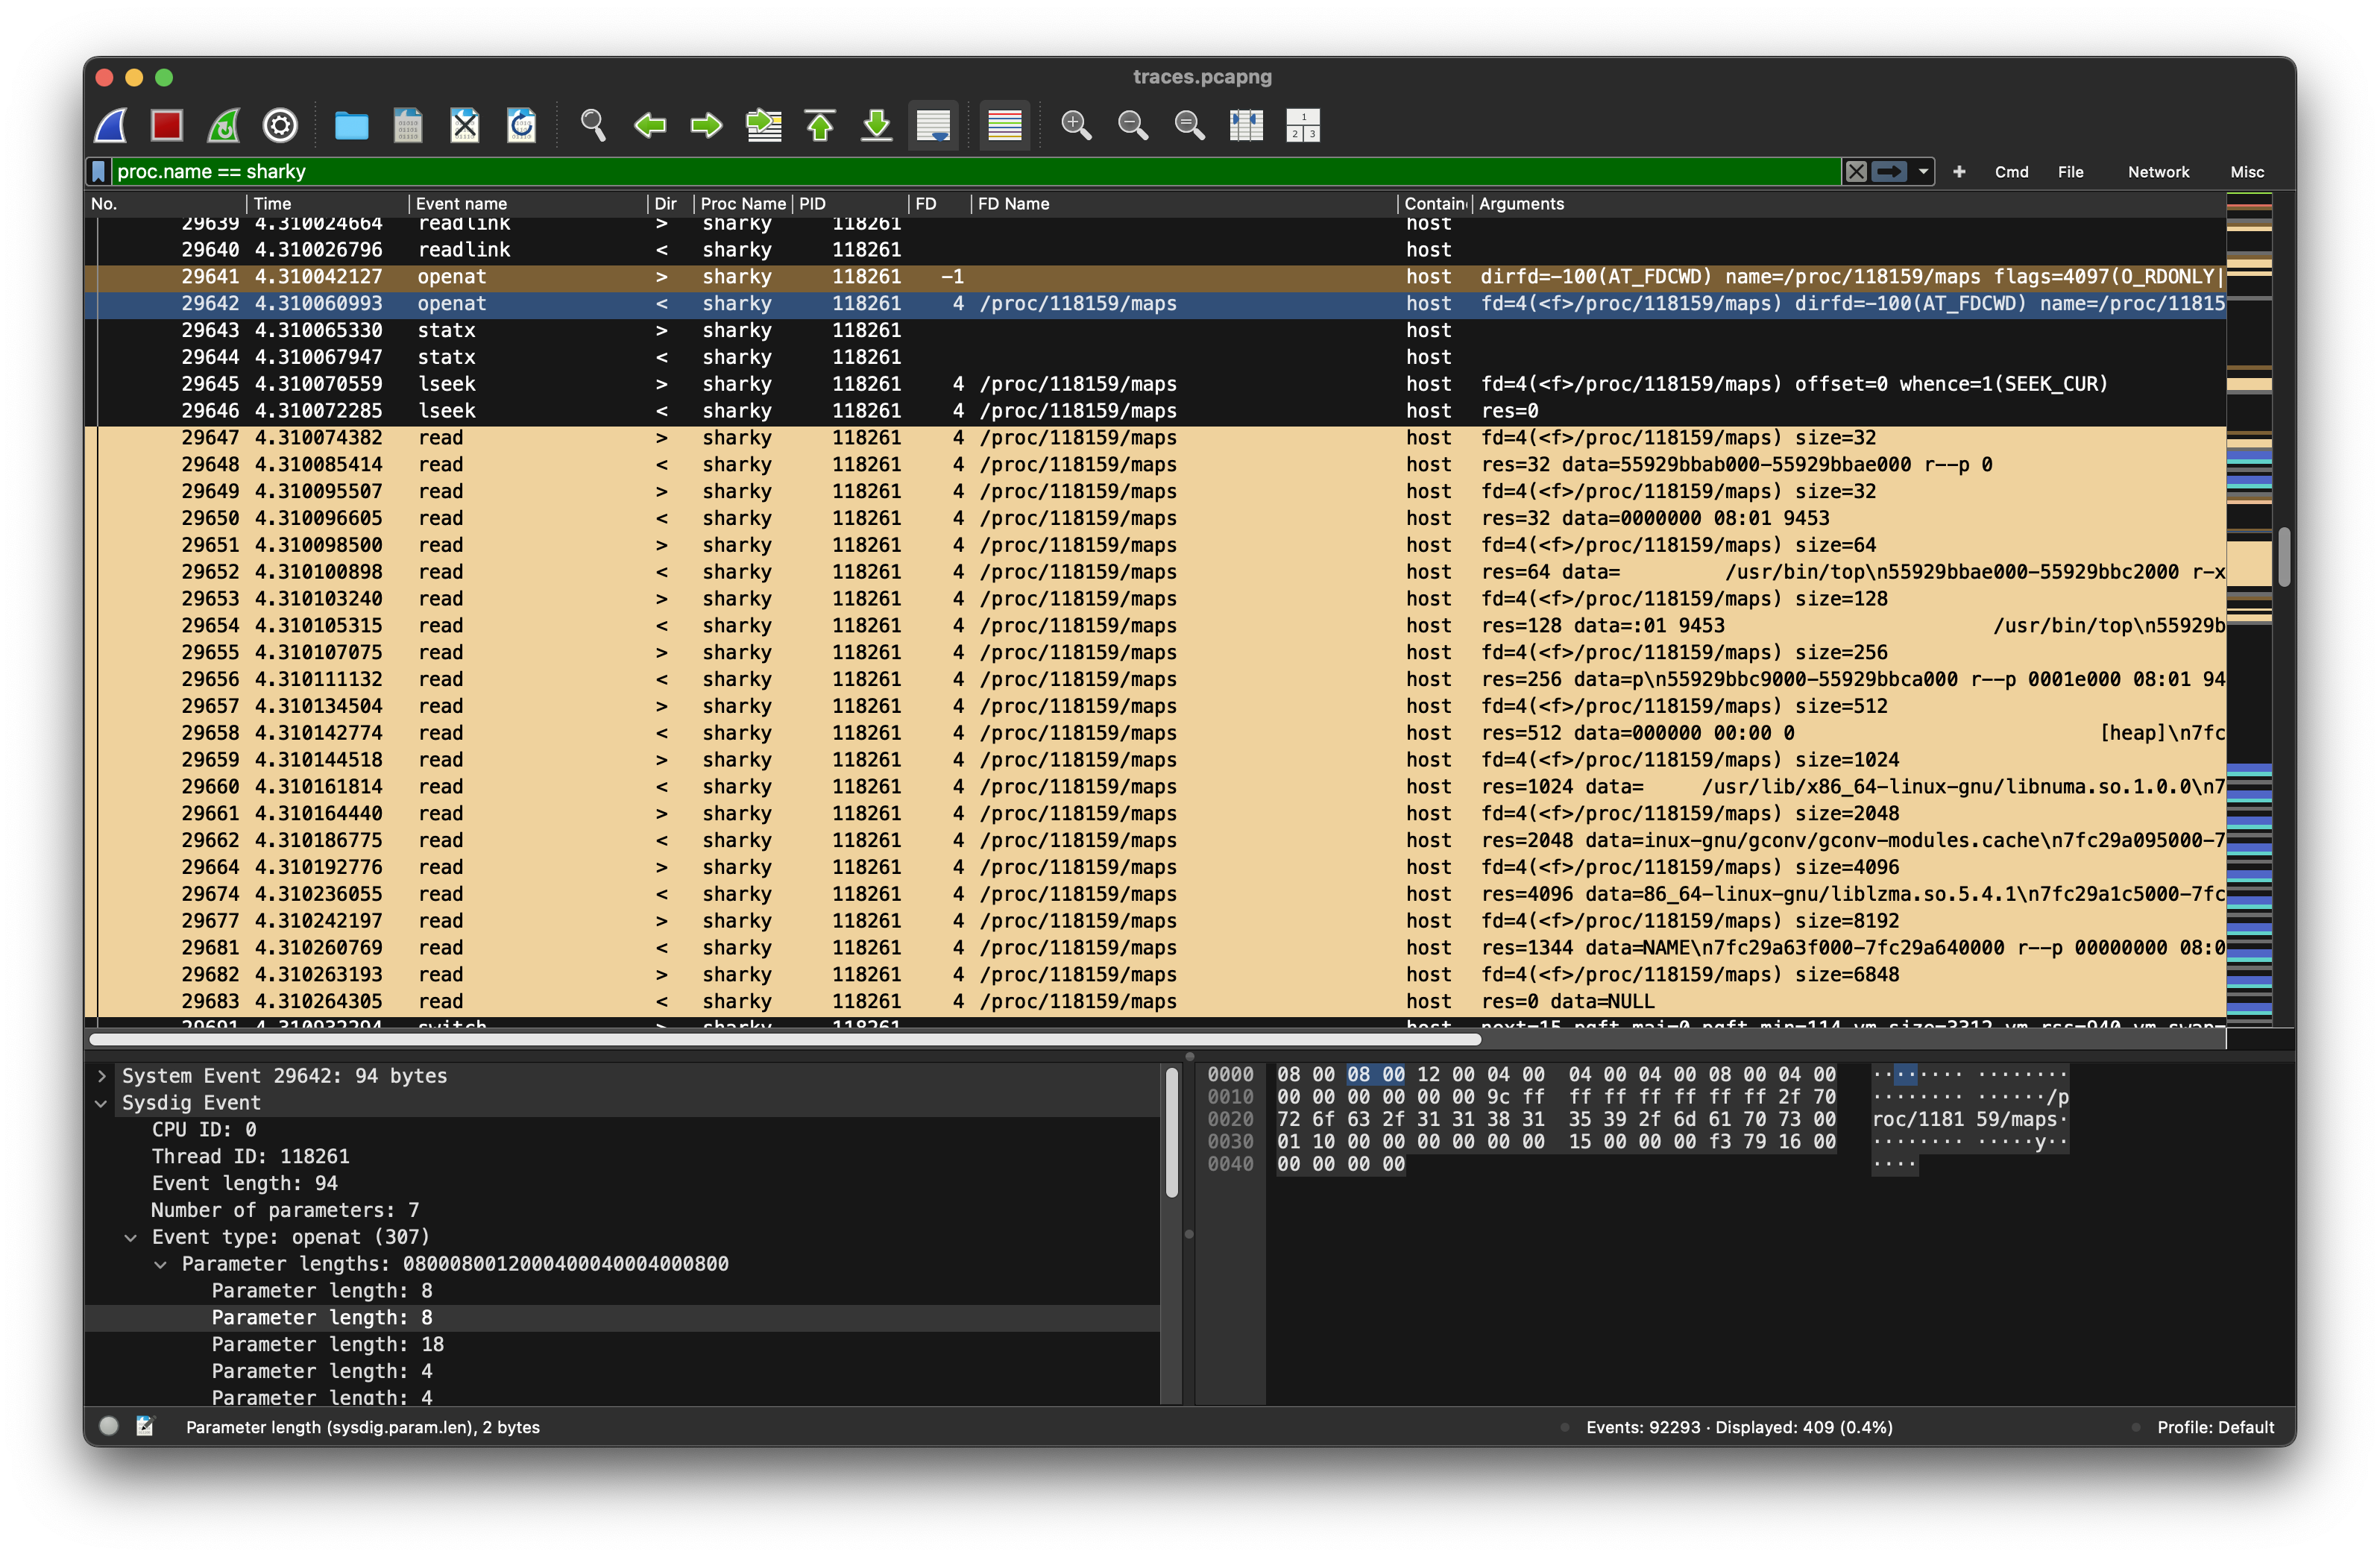
After having written the file, the suspicious actions continue: Sharky reads the memory map (4) of the top process (PID=1118159)
Active debugging session
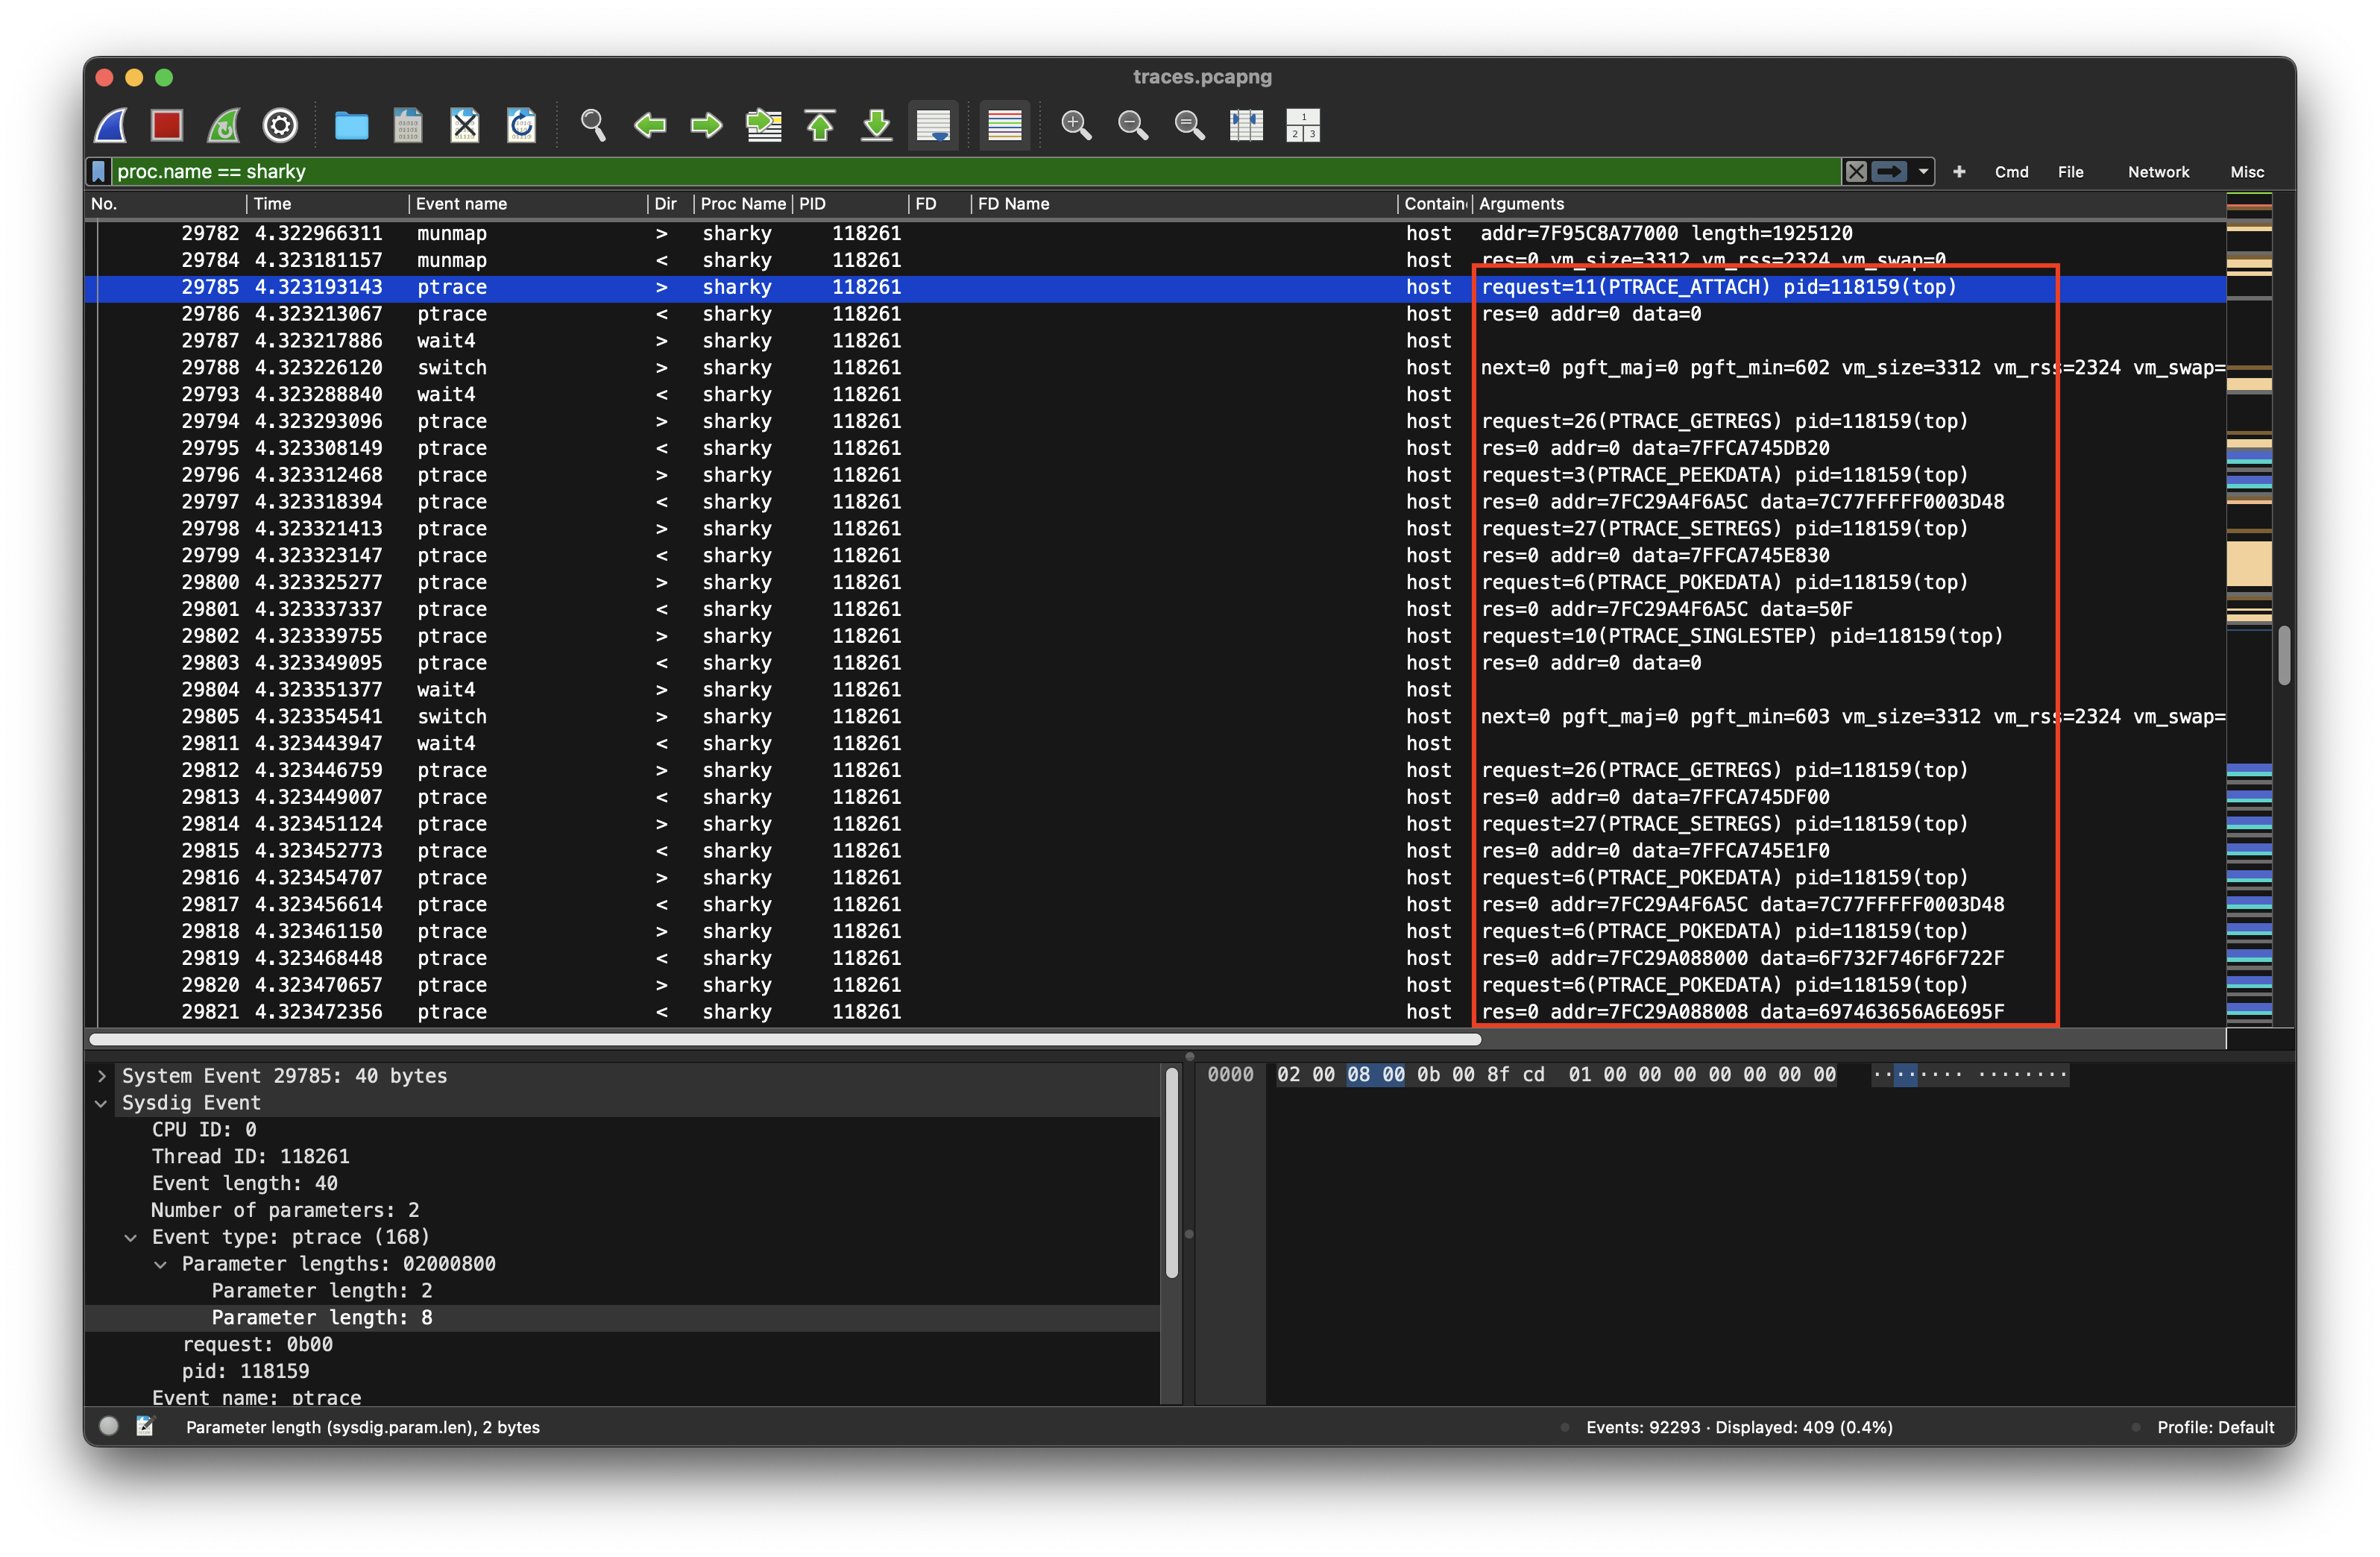
I have been so obsessed with the file-operations of shakry, that I just skipped and therefore missed the debugging session sharky has started at #29785. Sharky uses PTRACE_POKEDATA (Request = 5) to write a word of data into the memory of the traced process, which is top (pid=118159) in this case.
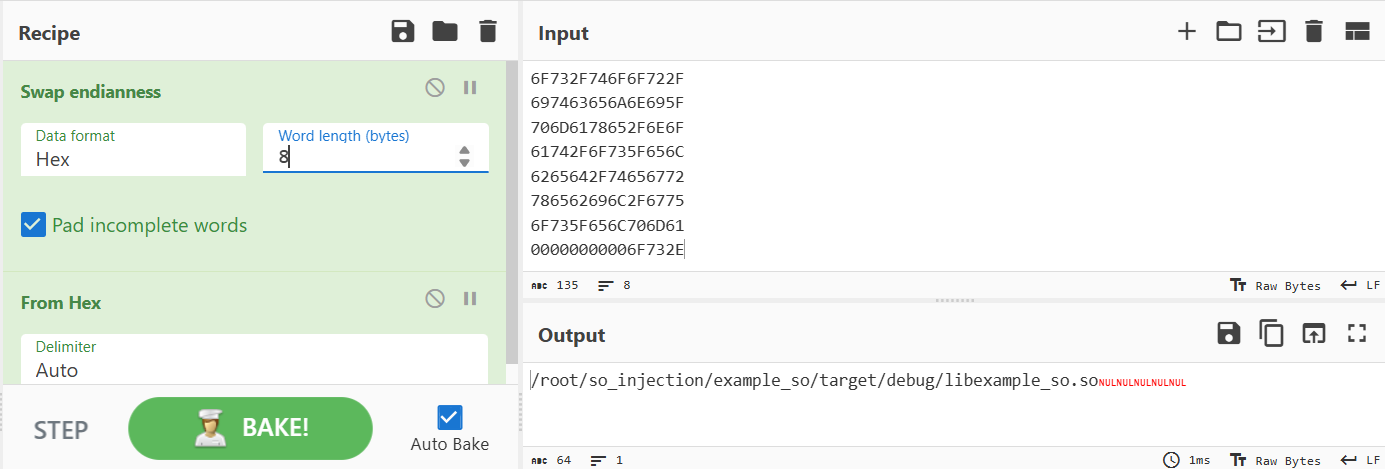
Let’s decode the data injected into the process-memory of the top-process:
0x7FC29A088000 = 6F732F746F6F722F
0x7FC29A088008 = 697463656A6E695F
0x7FC29A088010 = 706D6178652F6E6F
0x7FC29A088018 = 61742F6F735F656C
0x7FC29A088020 = 6265642F74656772
0x7FC29A088028 = 786562696C2F6775
0x7FC29A088030 = 6F735F656C706D61
0x7FC29A088038 = 00000000006F732E
The written bytes decode to: /root/so_injection/example_so/target/debug/libexample_so.so
What’s going on here?
We’re probably withnessing a runtime memory injection:
sharkycompromisestopusingptrace- The
.sofile likely does something bad (e.g., reads secrets, executes shellcode, contacts C2) - The access to
/tmp/3c6e0b8a...may be part of data staging (like the flag)
Sharky’s further actions
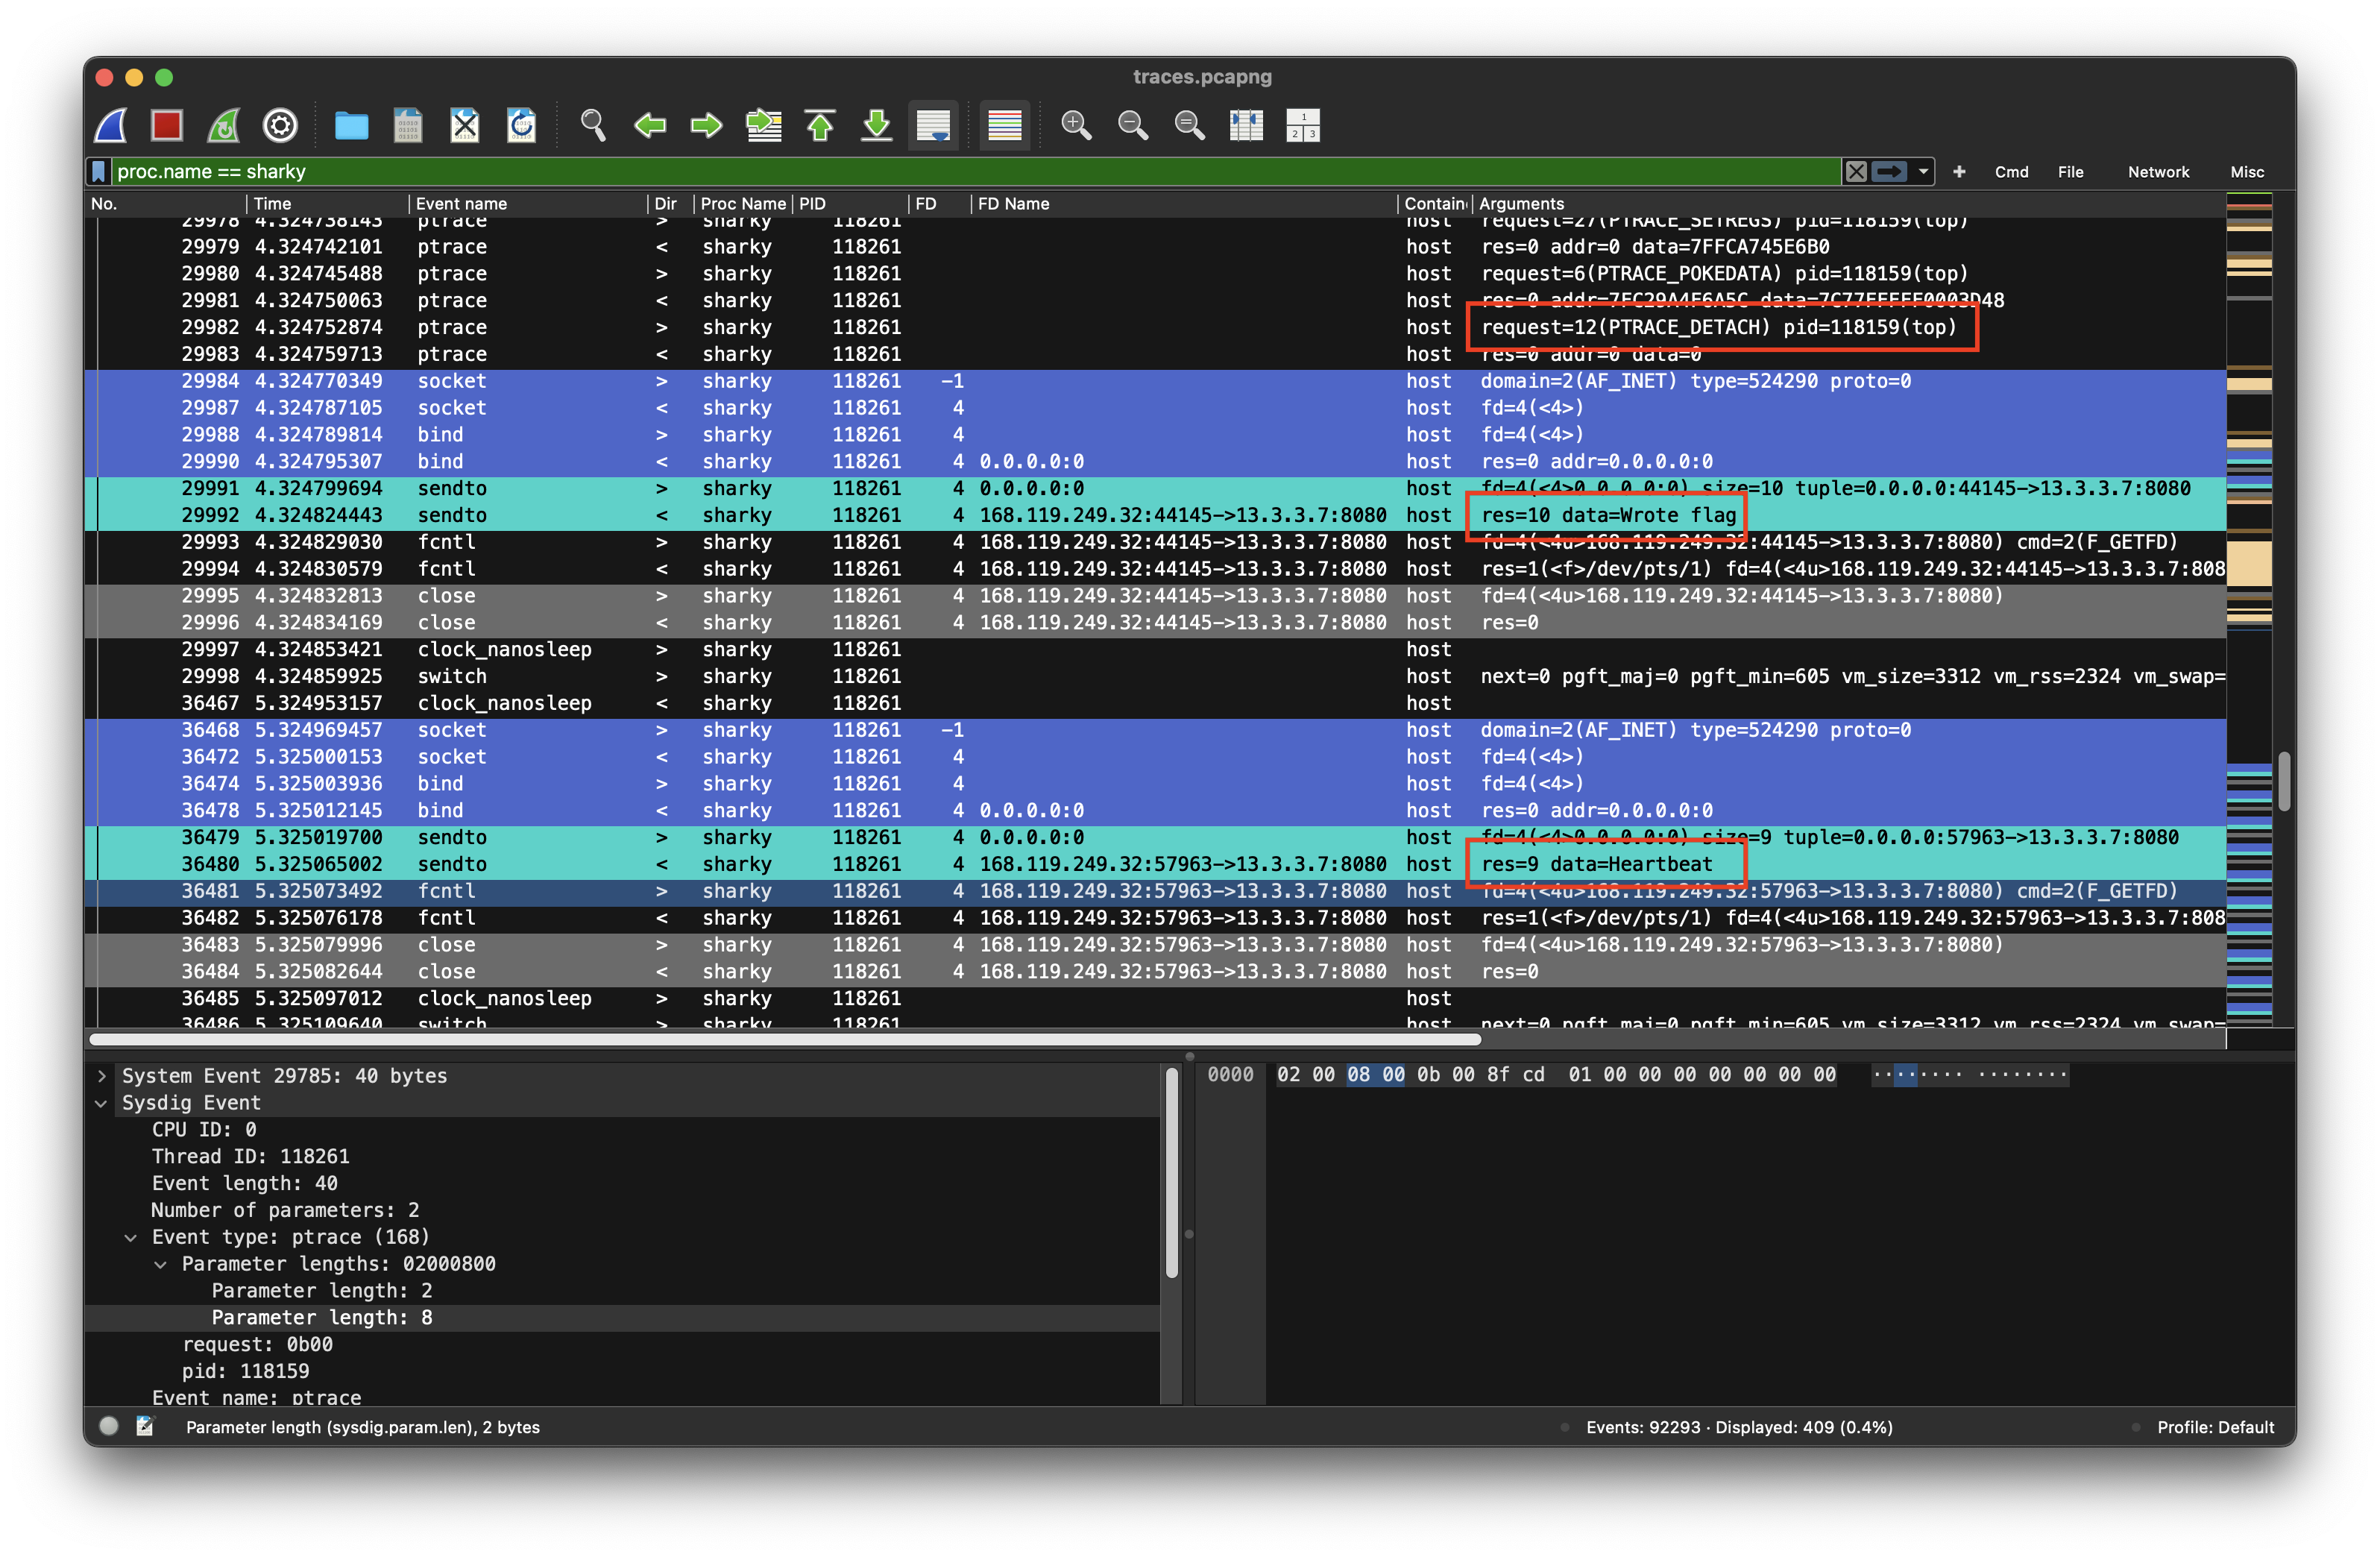
The next tile in this puzzle is are the following three actions of the sharky process:
- It detaches from the debugging session (PRTACE_DETACH, #)
- Reports
wrote flagto the C2 server at 13.3.3.7:8080 (@29992) - Sends
Heartbeatto the C2 server every second
Rabit Hole
Filtering too much: Only looking at a single process was a dead end, ause the connections and interplay are lost. Looking at the actions of the sharky process alone does only is only one part of what’s goin on.
Compromised top process
After getting out of the rabbit hole, it seemed like a good idea, to do a deep investigation of the top process after its memory has been tampered with proc.name == top
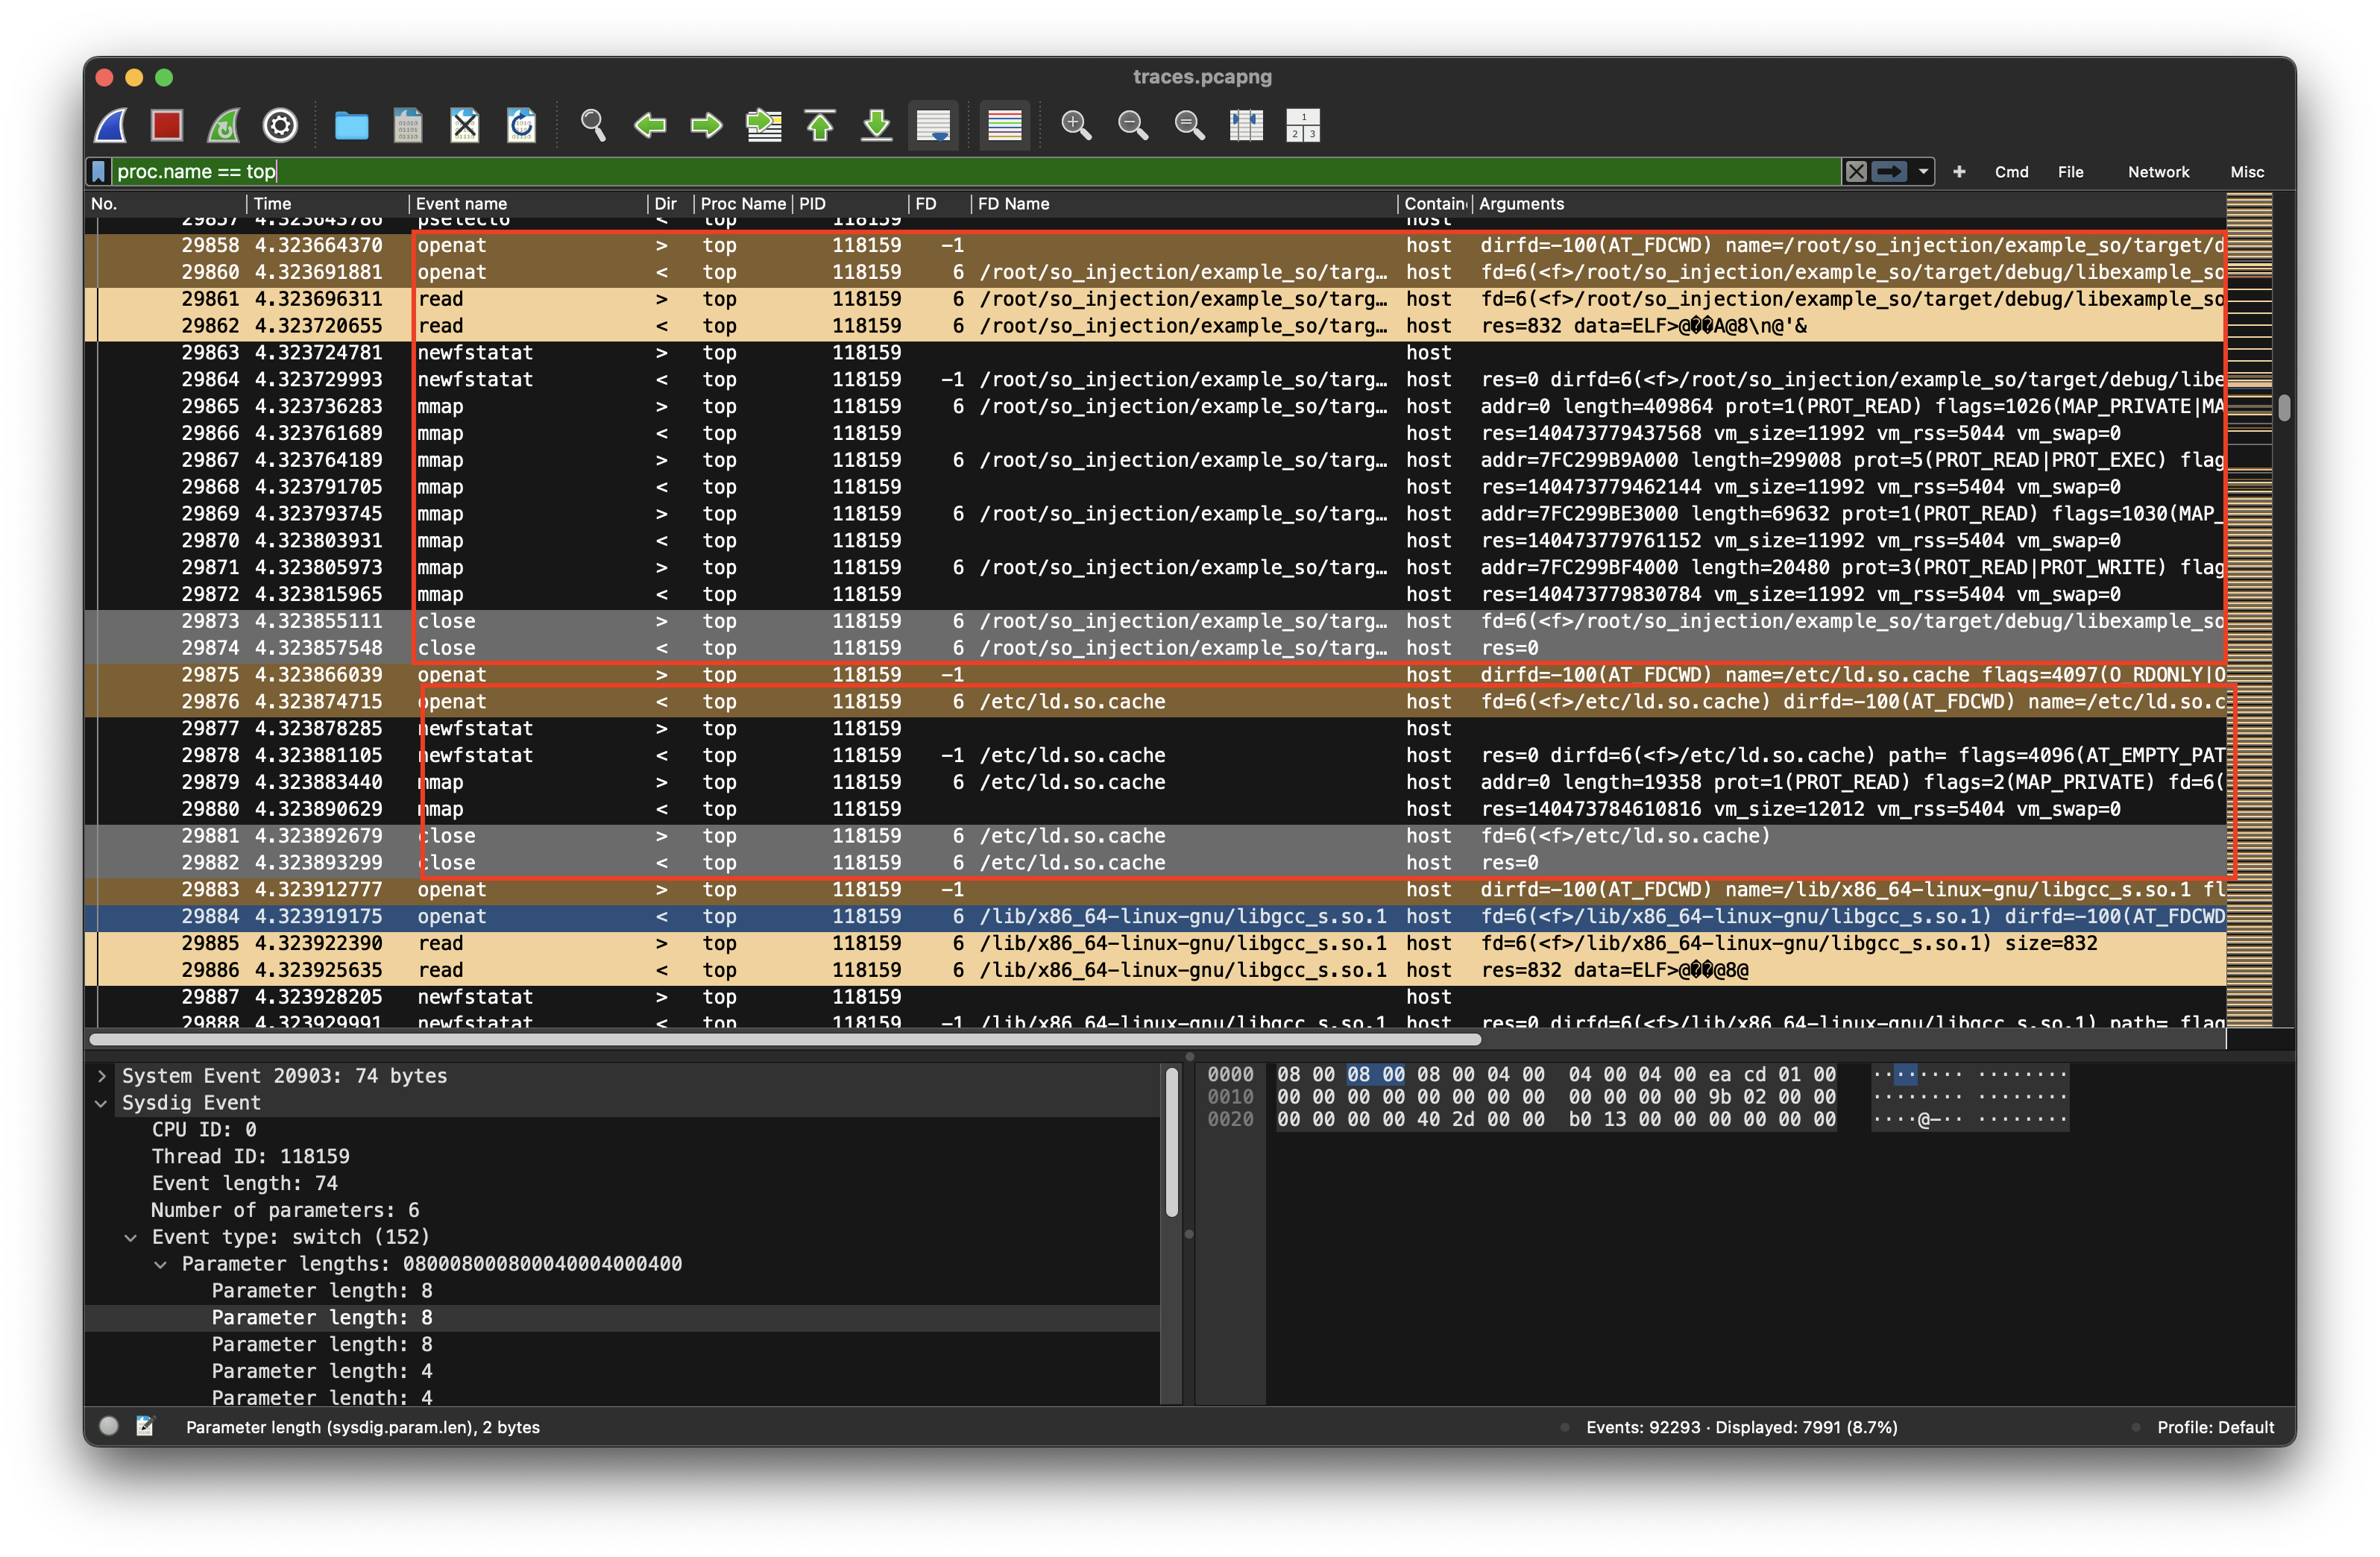
Load injected lib
At log entry #29860, after the debugging session has been detached, top opens dlopen("/root/so_injection/example_so/target/debug/libexample_so.so") which probably contains some bad code and loads it into memory using mmap() calls. The sequence resembles how the dynamic linker (ld.so) loads shared libraries into a process at runtime. After having loaded libexample_so.so its dependencies must be resolved (probably libgcc_s.so.1) Therefore /etc/ld.so.cache is opened which is a cache maintained by ldconfig that maps library names to full paths. It’s used by the dynamic linker to resolve dependencies faster. From the cache (or fallback search paths like /lib, /usr/lib, etc.,) the linker resolves: libgcc_s.so.1 → /lib/x86_64-linux-gnu/libgcc_s.so.1
Read key and write data
After loading libgcc_s.so and mprotect(mprotect() changes the access protections for the calling process’s memory pages containing any part of the address range in the interval [addr, addr+size-1]. addr must be aligned to a page boundary.) The data in the file /tmp/3c6e0b8a9c15224a8228b9a98ca1531d is read @29905
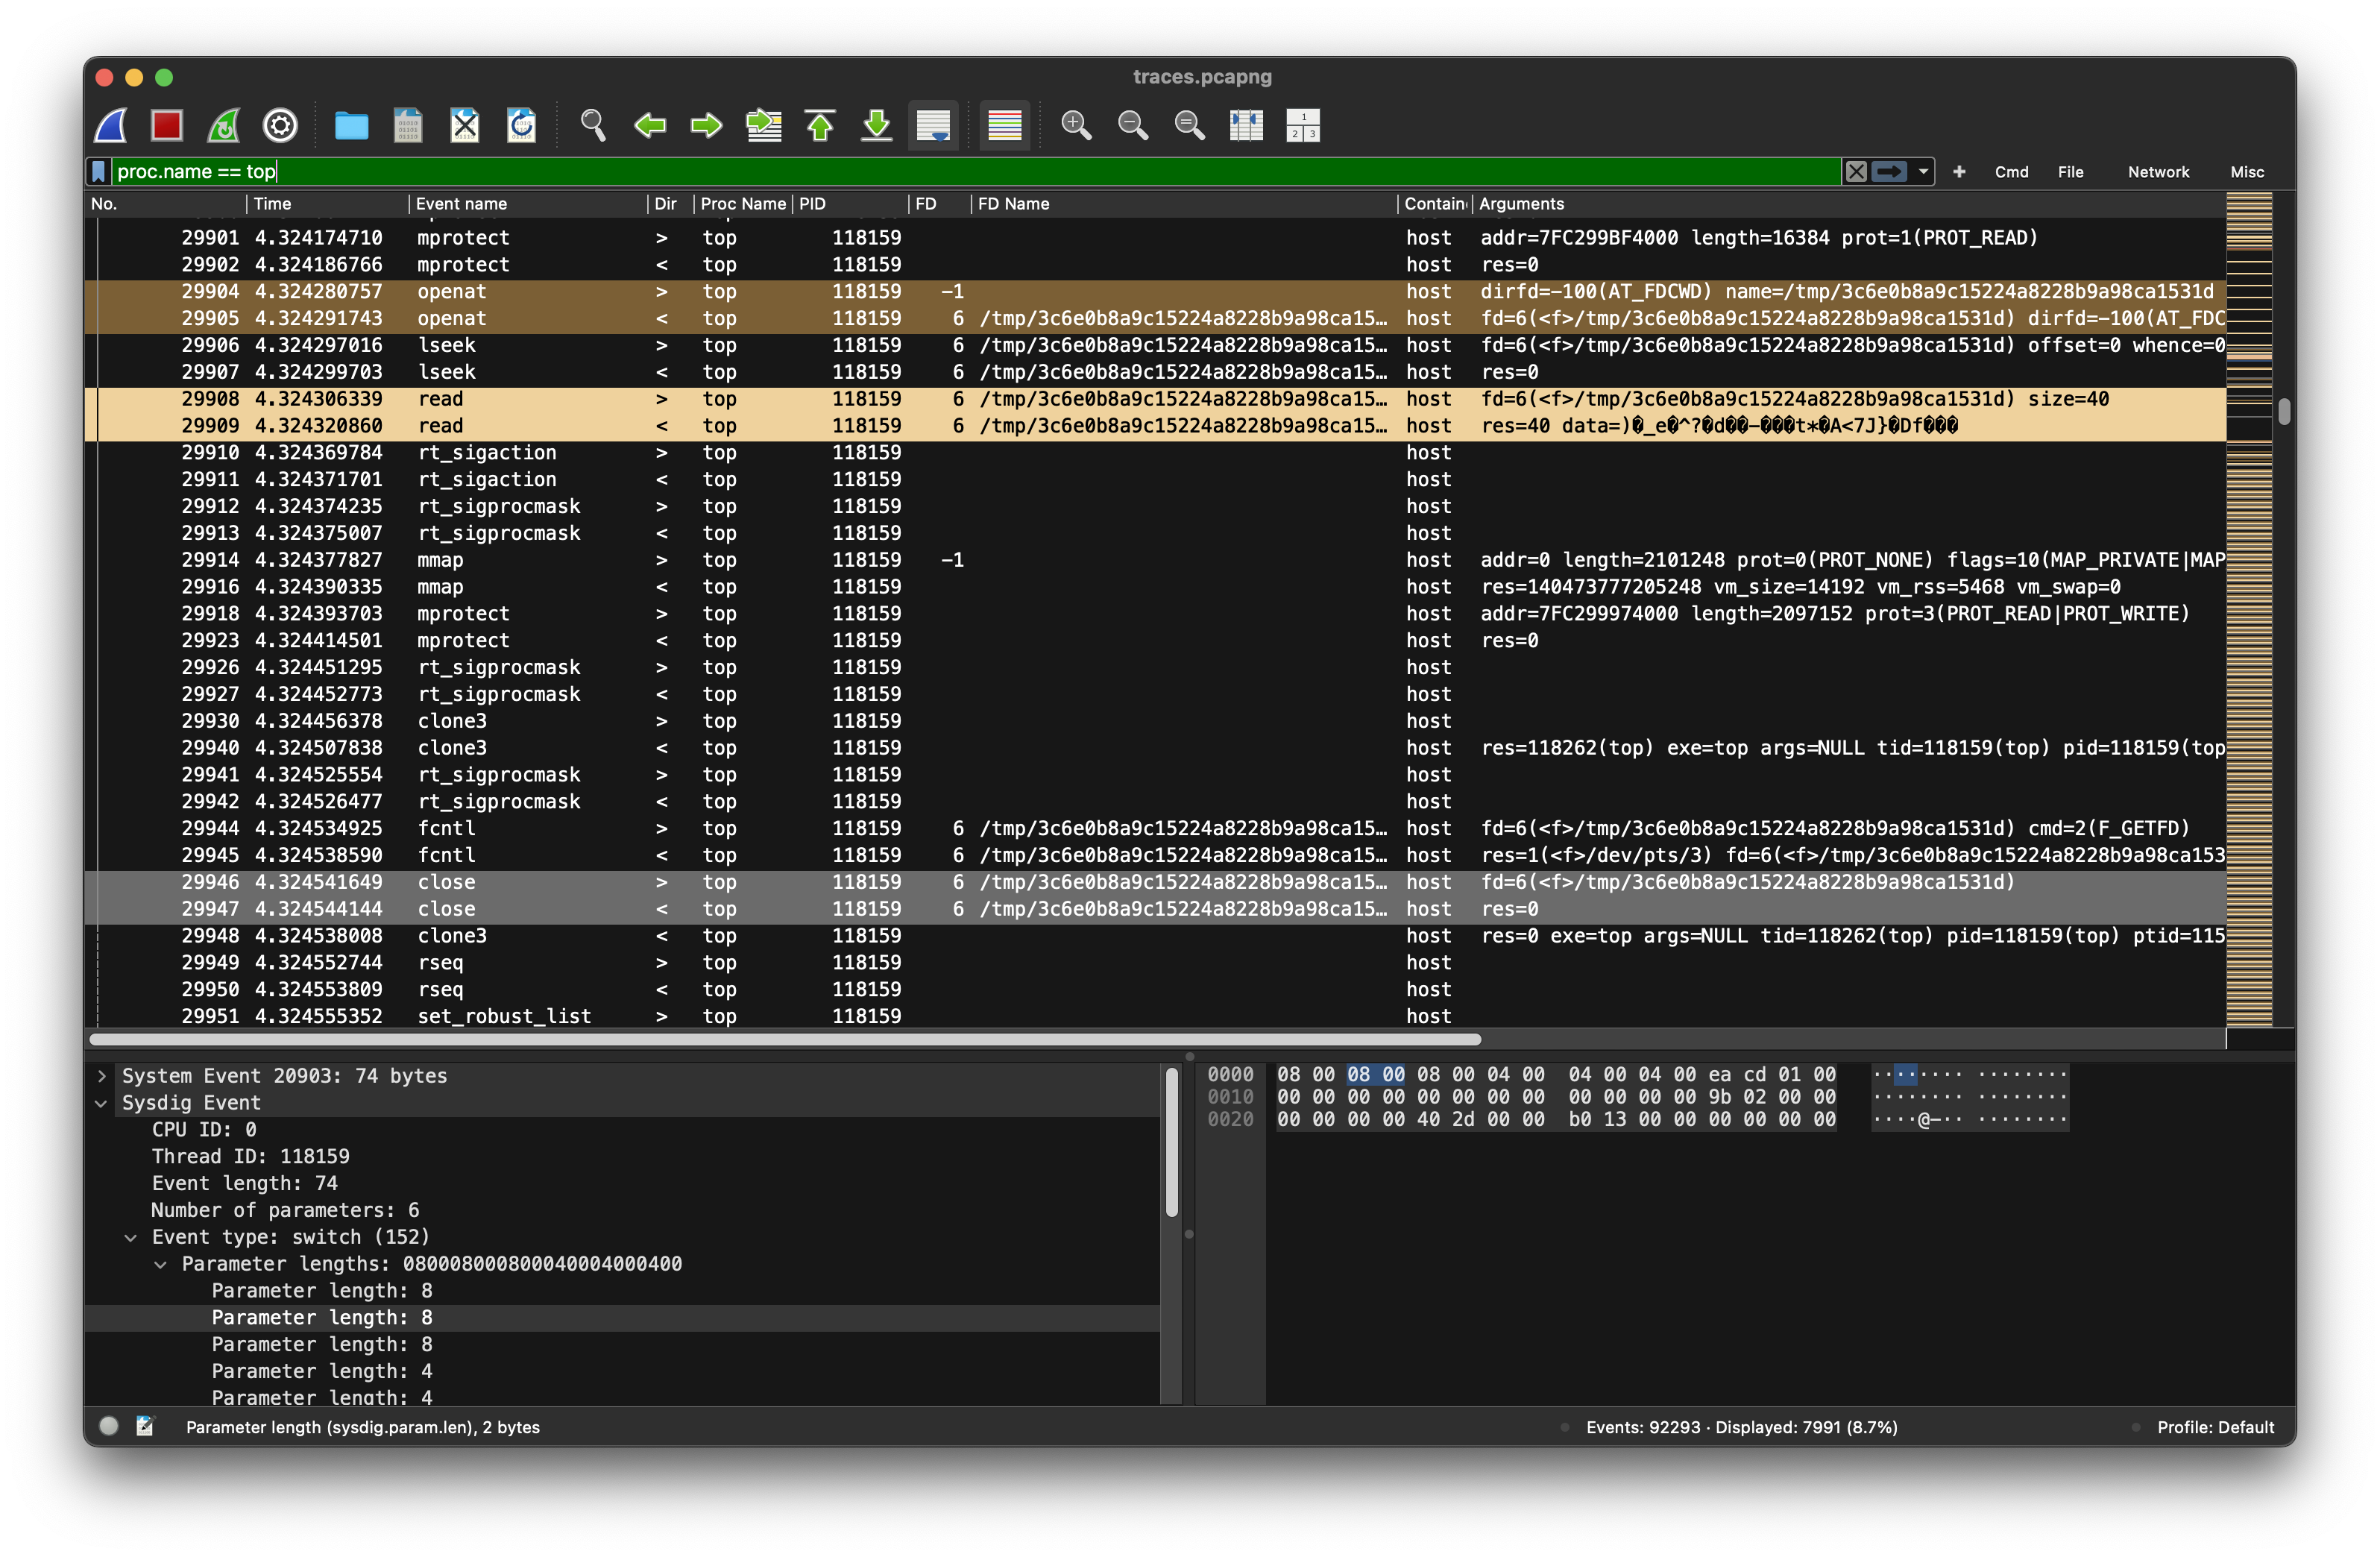
This is the file, where 40 bytes received from the c2 server at 12.3.3.7:8080 have been written to by the sharky process.
Next, the top process writes a new file /tmp/327a6c4304ad5938eaf0efb6cc3e53dc @36469 - the junk is 40 bytes long:
0000   08 00 28 00 28 00 00 00 00 00 00 00 4d f5 cc 37
0010   b6 55 4d 90 25 46 63 b5 cc 56 54 75 a9 af 45 e4
0020   82 cb 1d 44 b3 7a 1e 51 03 6d 6b 2b 0f 97 1b 55
0030   c4 f5 c1 6d
After the data has been written, the top process continues ‘normal’ operations, collecting data about system activity and processes.
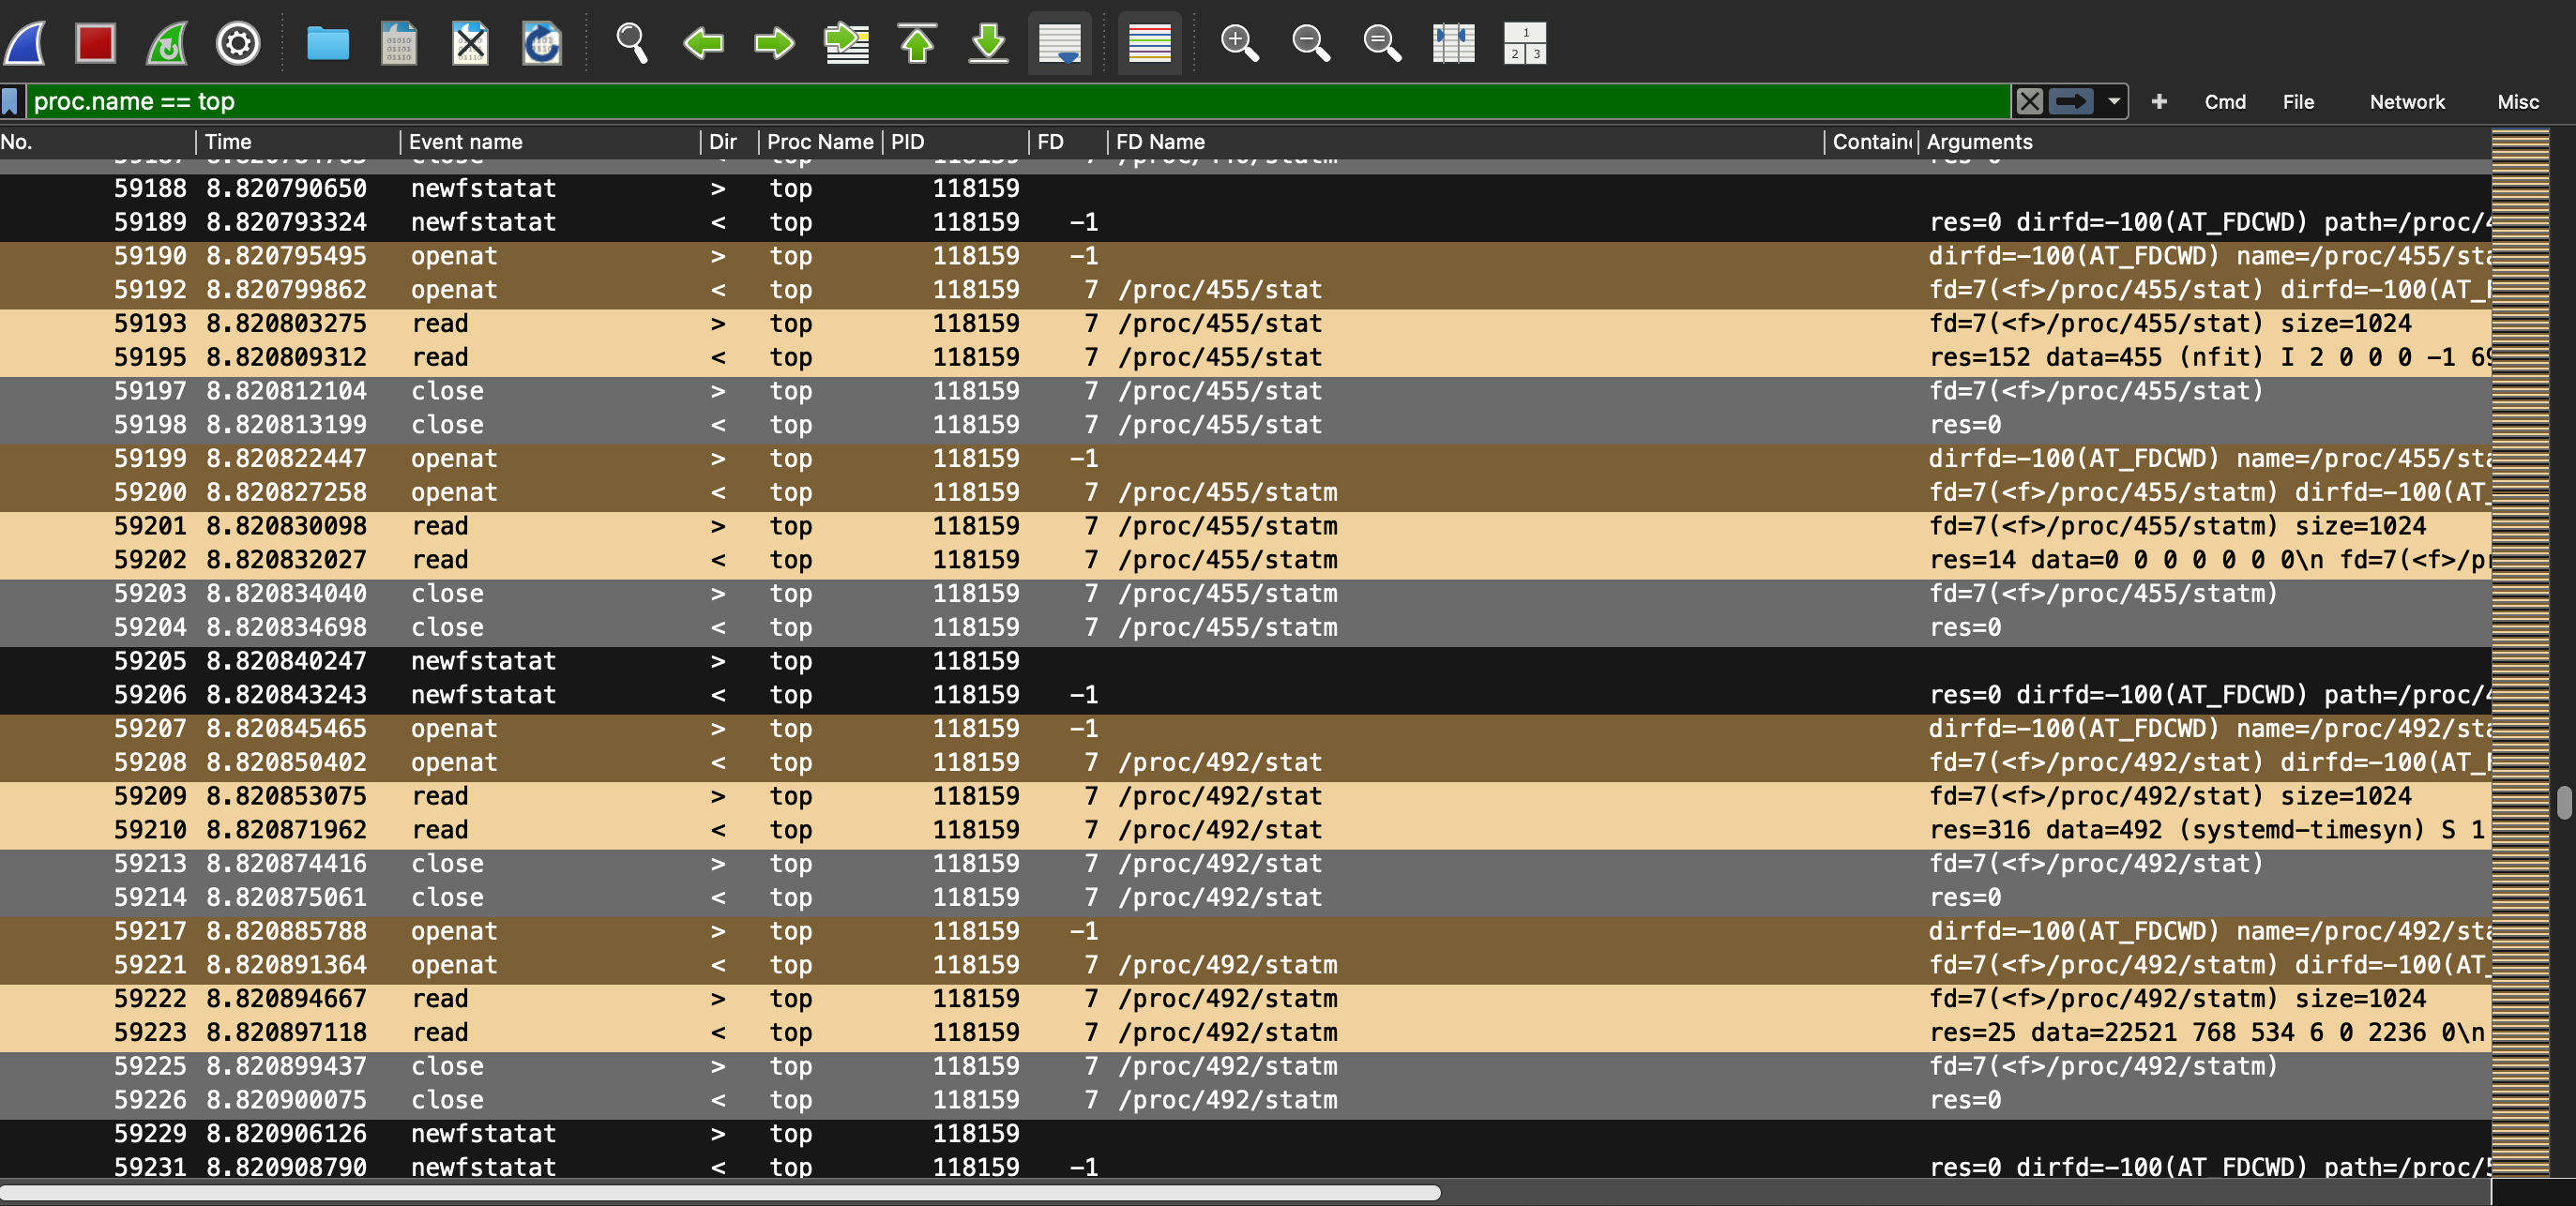
How top collects data
Top gathers system information by reading the /proc filesystem. It:
Reads /proc/stat for overall CPU stats
Reads /proc/meminfo for memory
Reads /proc/<pid>/stat, /proc/<pid>/statm, /proc/<pid>/status, etc. for each running process
When top runs, it scans /proc for all directories that are numeric — each corresponding to a PID of a currently running process.
Summary of reconnaissance
From the pcap file, we can deduce the following:
sysdigis running on a linux system being used as a vs code service- multiple ssh sessions to different IP addresses (possibly ssh tunnels)
- an unusual top process is running
- A suspiciuous
sharkyprocess, which is started in the second third (@29433). - After starting, it obviously connects to a c2 server, where it retrieves an encryption key (assume by the comment ‘received new encryption key’) and reports the success of its mission (flag written) to the server, before going into a passive mode in which it regularly (every second) sends a heartbeat.
- The memory of the
topprocess has been altered by a debugging session started from within the sharky process (PTRACE_POKE) after thesharkyprocess writes 40 bytes to the file/tmp/3c6e0b8a9c15224a8228b9a98ca1531din the tmp directory - After the debugging session has been closed, the top process reloads the library file and then writes 40 bytes to
/tmp/327a6c4304ad5938eaf0efb6cc3e53dc
Assumption
Confidential data (the flag) is encrypted and written to a tmp file by the top process, that has beeninfectey by sharky by injecting the path of a malicious library directly into the memory of the top process using a debugging session and
Solution
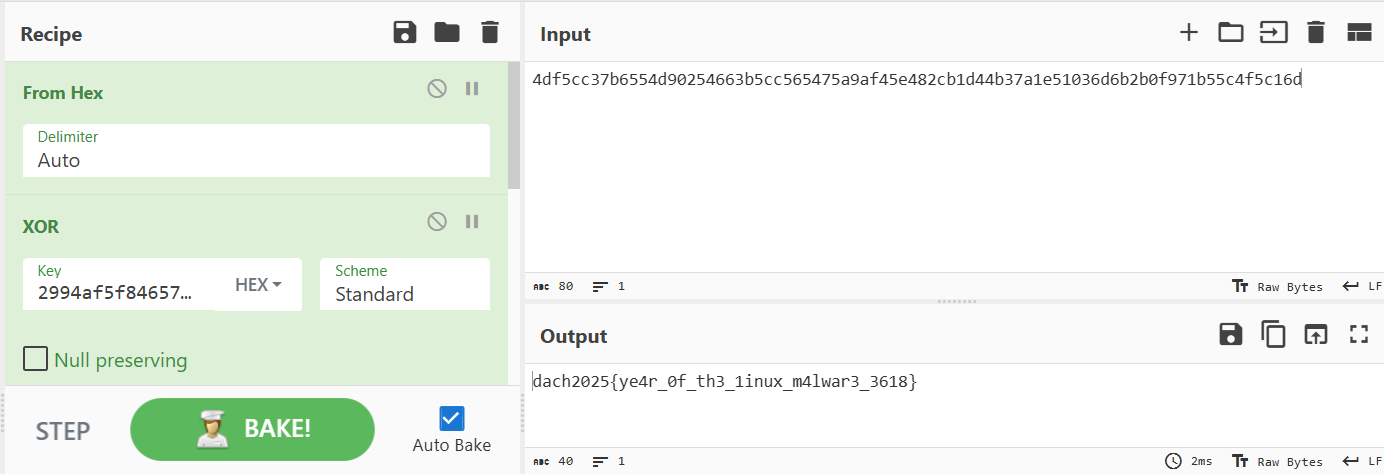
Decrypt the data in /tmp/327a6c4304ad5938eaf0efb6cc3e53dc using the data in /tmp/3c6e0b8a9c15224a8228b9a98ca1531d as the key. Because the key and data have the same length, a ‘stream cipher’ is assumed which has to bee symmetric.
key    = "2994af5f84657fa55e3f0681be096413f6db2dd7ddfa742ac602413c37011c4a7da44466f2c4f910"
cipher = "4df5cc37b6554d90254663b5cc565475a9af45e482cb1d44b37a1e51036d6b2b0f971b55c4f5c16d"

key_b = bytes.fromhex(key)
cipher_b = bytes.fromhex(cipher)

flag = bytes([x ^ y for x, y in zip(key_b, cipher_b)])
print(flag)
Flag: dach2025{ye4r_0f_th3_1inux_m4lwar3_3618}
Conclusion
- Consider the hints of the challenge authors: “stratoshark” and the “wireshark guys”
- When presented with a caputre file (netcap, sysdig), it might be good idea to look at the statistics first to get an overview
- Filtering the write action quickly yields interesting insights of io operations (files, networks) and possible connections between the monitored processes.